Research offers solutions to “unpiggable” pipelines
Michael Schorr • Hubert Lindner • Marc Fischer
ROSEN Technology and Research Center
As oil and gas development moves further and deeper offshore, pipeline operators worldwide tend to look closer at the future inspectability of the pipelines they are planning to build. History has shown that the vintage designs often prohibit or limit inline inspections, as they were not considered when they were first engineered and constructed.
Today’s most common inspection technologies are magnetic flux leakage (MFL) and ultrasonic technology (UT). Approximately two thirds of the world’s oil, gas, and product pipelines can be inspected with off-the-shelf inspection tools. The other third is deemed “unpiggable” or “challenging” at the very least. This results from the fact that with few exceptions it was common industry practice to involve any ILI provider only at a project stage when an ILI inspection is imminent. This way knowledge and experience as well as innovation potential were left untouched.
The primary factors that render a pipeline “unpiggable” are diameter changes, pressure, line wall thickness, product velocity, product type, installations, or a combination thereof.
To start changing this, ROSEN assembled a team of specialists that is working on case studies for numerous clients throughout the world. Currently, this is done mainly to consult on existing cases, but more often, to review a pipeline system during its design process.
Below, case studies are presented for different systems that discuss the following:
- Existing challenging systems
- Design review to confirm inspectability of alternative solutions
- Design review of new pipeline system for inspectability and pigging economy.
Existing challenges
Operators of subsea systems, especially in deepwater regions like the Gulf of Mexico and offshore Brazil, are often met with challenging or unknown conditions where a straight forward pigging is a high risk for the pipeline operation. A system shut down, or worse - system failure - would be unacceptable.
Many of the “show-stoppers” can be taken care of by detailed research and individual tool design. Product velocities exceeding the operating specifications of ILI tools can be taken care of by specifically designed tools which optimized drag and maximize speed control functions.
A multitude of multi-diameter systems (pipeline systems with a diameter range larger than 2-in. difference) were reviewed for piggability and inspectability, such as 12-in./18-in., 26-in./30-in., 30-in./36-in., 32-in./42-in., and 28-in./42-in.
Multi-diameter system
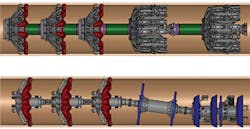
One exemplary multi-diameter case was a 14-in./18-in. deepwater application where multi-diameter tool development was taken one step further. The tool concept and later the actual tool were designed to cover the specific parameters, features, and installations the asset held:
- Pipeline length: 163.9 km
- Diameter: 14-in. for 11.9 km (wall thickness: 20.6 mm - 22.2 mm)
- Diameter: 18-in. for 151.9 km (wall thickness: 22.2 mm - 28.6 mm)
- Bend radius: 5D
- Maximum water depth: 1,900 m
- Maximum pressure: 290 bar
- Known minimum ID: 300 mm
- Medium: natural gas.
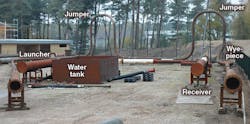
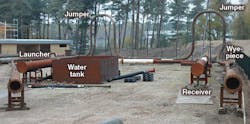
Furthermore, the pipeline had several subsea appurtenances (notably check valves, connectors, ball valves, tees and reducers), two jumpers in the subsea connection segment, and an adjacent Y-piece. The transition from the 14-in. to the 18-in. section occurred in one leg of the Y-junction. This meant that one part of the cleaning or inspection tool had to expand its driving unit and pass the cavity of the Y-connection while its rear parts were still in the 14-in. pipeline.
Tests were conducted in a full size test set-up at the ROSEN Technology and Research Center, Germany, which featured all the mentioned crucial pipeline features of the original system.
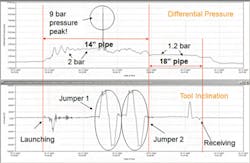
During the various test runs, pipeline flow and pressure were measured; and in combination with differential pressure and tool inclination, provided reliable information on tool performance within the system. With these measurements at hand, the engineers were able to optimize tool behavior where necessary.
At the end of the development process, a proven design was delivered and the line was inspected successfully to the full satisfaction of the client.
High-pressure system
A client contracted ROSEN to assess the feasibility of operating various multi-diameter tools for geometry and metal loss inspection at high pressure in its pipeline in the Gulf of Mexico. Further, it was agreed that ROSEN would perform large-scale pressure tests to prove the high-pressure capabilities of their inspection tools.
Apart from the multi-diameter set-up and high wall thickness of the system, the high-system pressure of up to 518 bar (7,500 psi) was identified as the main challenge. Pressure tests proved that sensors and tool components of various inspection techniques can withstand high pressure values. A tool concept has been developed to achieve full inspection of the pipeline system.
FEM calculations
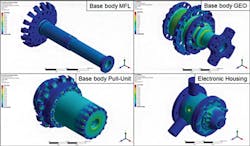
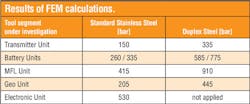
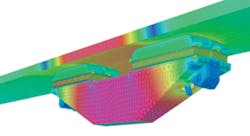
To evaluate the behavior of the tool mechanics under pressure, FEM calculations were performed on tool segments (pressure vessels) of comparable tool sizes. The goal was to prove the feasibility of building tool segments which could withstand high pressures up to 518 bar. For reference calculations, an existing design of a 20-in./26-in. MFL and geometry tool was chosen.
The results of the initial calculations proved that high-pressure values already could be achieved with the ROSEN standard tool design. Before the next calculation step, the material type was changed from standard stainless steel to duplex steel. The result proved that except for the transmitter unit and for the geometry unit, all units would withstand high pressures as requested. With the final step, which is increasing the wall thickness of the units under investigation, all units would withstand more than 518 bar (7,500 psi).
In summary, it can be said that by using high pressure resisting materials in combination with the right material thickness, mechanical tool segments (pressure vessels) can be designed and built. Further findings from these investigations are that high pressure O-ring seals need to be used. These types of seals have a higher hardness and a higher thickness. Consequently, this needs to be considered within the mechanical design of the tool segments.
Test procedure
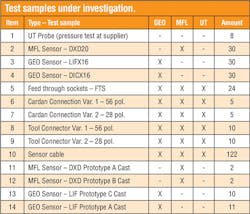
The pressure tests on sensors and components were performed in two steps. In the first step, all test samples were initially pressure tested to a pressure of 450 barg. All samples which passed the test were qualified for the next step. This initial step was performed to qualify the test samples for the high pressure tests and to identify the borders of the existing sensor and component design. On the findings of these tests, prototypes were manufactured to prove the concept in the following step.
In the second step, the test samples (including rapid prototype samples) were tested up to a pressure of 550 bar.
The first step was performed at ROSEN Technology and Research Center (RTRC), Lingen, Germany, while the second step was performed at the University of Rostock, Rostock, Germany, with ROSEN engineers present to witness the tests) which have the possibilities to perform pressure tests up to 600 bar.
During the test execution, all functions and signals of the test samples were monitored and recorded. The pressure medium was water and the test was performed at ambient temperature. After each pressure test all test samples were tested on function. The recorded data was evaluated after the pressure test.
Pressure starting point: 100 bar/1,450 psi
Pressure ramp up step size: 50 bar/725 psi
Pressure holding time: 0.5 h at every step value
Maximum pressure point: internal: 450 bar/6,527 psi | external: 550 bar/7,977 psi
Pressure holding time: 3.0 h at maximum pressure point
Acceptance criteria included:
Visual inspection.The sensors have to pass a visual inspection, where sensors are checked for any visible mechanical damage.
Functionality check. Before and after the pressure test, the sensors were connected to an electronic to check the functionality of the sensors. All sensor channels had to be verified for functionality.
Data evaluation.When the sensors passed these tests, the recorded data during the pressure test was evaluated to verify that they did not have any malfunctions when they were under pressure, and to determine at which pressure value the sensor failed.
Test results
The sensor data which was recorded was evaluated during the pressure test. All sensors sent back data to a data logger. The values which were sent back needed to be in a pre-defined range to pass the test. The sensors which were lying above the threshold did not pass the test.
In summary, it can be said that all sensors and components performed well and as expected during the pressure tests. All sensors and components passed the pressure tests up to 550 bar.
The most important findings from the pressure tests were that the main focus had to be on the production process of the sensors, and on the material used to manufacture the sensors.
No general adaption of the design of the outer dimensions of any sensor or component is required. It was observed that sensors failed (independent from technology), whether directly during the pressurizing phase or during the depressurizing phase. The root cause for this was identified in the production process of the sensors. The sensors are built up in several steps. In the first step, the electronic components are assembled and afterwards these components are cast into the formative and sealing material.
Looking into the details of the casting process, weak points have been identified with regard to high pressure application. Air pockets introduced during the casting process may remain during the hardening of the material. Pressurizing or depressurizing these flawed sensors can lead to electronic failure as they are rapidly compressed or decompressed.
The manufacturing process was optimized for the test samples and will be optimized for the sensor production of high-pressure sensors in future. The casting material will be enhanced to basically eliminate the risk of air inclusions and deliver a higher durability in its final aggregate state.
Alternate solutions
Apart from feasibility reviews of existing subsea systems, the industry has been expressing interest in alternative systems or system extensions. These alternative designs give offshore pipeline operators confidence in their ability to have inline inspections performed in a safe and reliable manner.
A sample case for this type of enquiry was the extension of an existing system with a new pipeline. The new tie-in was planned to be either 18-in. or 16-in., where 16-in. was the preferred dimension.
The challenge was not only to determine the inspectability of the extension, but also to determine if the ILI tool could travel through the existing line sections up to the receiving platform. In this case, 24-in. and 28-in. were possible. Additionally, the inspectability of the 24-in. section had to be reviewed.
The ILI services to be included in the study were metal loss, circumferential cracking, geometry and XYZ mapping. The primary challenges identified early in the study were
- Wye passages in 18-in. (or 16-in.) and 24-in.
- Multitude of jumpers in all three diameters
- Subsea manifolds in 24-in. and 28-in.
- 1,500 m to 2,100 m water depth
- High WT > 1-in.
To address these challenges, engineers considered an existing 18-in./24-in. MFL tool, where the pull unit was replaced by a new concept design to cover the 28-in. section as well.
Based on the conceptual design of the pull unit and the exhaustive experience in multi-diameter development combined with the inspection record of the existing MFL unit, a feasible concept was identified as one of the possible solutions for this complex challenge.
The team also considered an existing 16-in. UT tool where the pull unit was replaced by a new concept design to cover the full range desired by the client, 16-in. to 28-in.
This concept represents a second solution to these types of pigging dilemmas. This time a new pull unit, in combination with an existing UT tool, was proposed as one of the possible solutions for this complex challenge.
Apart from giving the client a range of options for an inspection of the pipeline, the main and foremost important question was answered: It was possible to develop a 16-in./28-in. multi-diameter tool to inspect 16-in. and still pass through 14-in. and 28-in.
With the study results, the client had confirmation and confidence that the preferred 16-in. solution was feasible, thus saving the client a significant amount by reducing his construction budget and also enhancing production performance.
Design review
Taking it one step further, an operator can involve an ILI provider during the planning phase of a new pipeline system. In cases like these, pipeline design will not only be reviewed for suitability and adaptation/creation of ILI tools engineered, but the ILI provider can also give valuable input for the actual design and layout of the new system.
Long-distance inspection
Recently, ROSEN was approached by a client to review the availability of intelligent pigging technologies to pig a long-distance, large-diameter gas pipeline. After reviewing the constructional and operating parameters known so far, the following main factors were identified:
- High wall thickness
- Product velocity
- Line length.
FEM calculations
High resolution MFL inspection is only achieved if the magnetization level is between 10 and 30 kA/m for standard pipe material. Tool speed, wall thickness, and material changes influence these levels and need to be taken into account while planning a new pipeline system.
FEM models, taking into account all existing parameters, can determine the level of magnetization at a predetermined wall thickness.
Tool velocity
Another major impact on the performance of current MFL technologies can be seen in gas velocity and velocity changes, which influences the recording/sampling interval. MFL technologies are measured at intervals in longitudinal direction. This is called the recording/sampling distance and it determines the longitudinal resolution. Accurate sizing of defects is optimal if the sampling distance is maintained at 2.5 mm interval, which normally can be guaranteed at a tool velocity of 0.5 m/s to 3 m/s. Maximum tool velocities of 5 m/s might be managed by an intelligent MFL tool, while loss of sensitivity, loss of pre-set resolution in longitudinal direction and possible mechanical damage might occur outside of the above mentioned limits. Opposite, lower velocities than 0.5 m/s in gas lines might incur unstable pig running conditions, which in terms of achieving an appropriate and accurate data basis are also to be avoided.
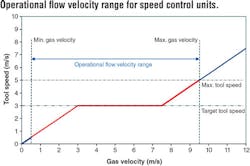
Having calculated the average gas velocities in function of absolute pressures for the present pipeline, the utilization of a speed control unit (SCU) was mandatory during any inspection run. The SCU provides controlled bypass to reduce the tool velocity while aiming to achieve the programmable target tool speed and to keep it constant.
Describing the functionality of the SCU for the chosen example, the MFL tool speed increases with rising gas velocities. For the underlying case, until having reached the target tool speed of 3 m/s no corrective measures are taken. Within the set boundaries described through the horizontal graph (gas velocity between 3 m/s and 7.5 m/s) the SCU is taking corrective measures, allowing subsequent for bypass and keeping the tool speed constant to the target level. By gradually opening the SCU valve, bypass capability increases, reaching the maximum capacity at 7.5 m/s gas speed. With further increased gas velocities (> 7.5 m/s) hence the tool speed is accelerating exceeding the boundary of a maximum tool speed of 5 m/s at a related gas velocity of 9.5 m/s with the consequence that the required sampling interval and hence specifications are not being kept.
Besides guaranteeing an increased data quality due to an adjustment to an optimum tool velocity, the utilization of a speed control unit maintains the high gas flow rates during the entire inspection, avoiding simultaneously throughput losses resulting from potential flow rate reductions required without utilization of SCU.
Tool inspection capacities
The main cornerstones for inspection capacity of this magnitude are:
- Battery capacities which define the maximum run time of an inspection tool and in combination with tool velocity the maximum inspection range. Generally, the inspection range is limited by the amount of batteries an ILI tool can store in its compartments and more important by the energy consumption of its components. ROSEN tools are designed with the latest in electronic technology to reduce energy consumption to a minimum while maximizing feature detection capabilities. If this is not enough, adding an additional battery compartment is the most used solution to ensure sufficient energy supply and giving an additional spare for any unexpected delays.
- Memory capacities which limit the amount of data that can be stored in an ILI tool and therefore determine the resolution and inspection range. Data storage capacities of modern tools are normally limited only by the amount of space available to install memory modules. In this case more than one Terabyte data (MFL, IEC, GEO, XYZ) was collected and evaluated.
- Long-distance run capacities of sensors and sealing components which enable an ILI tool to ensure reliable, constant measurement and also pass the whole pipeline system in a safe and controlled manner. The in house development of special polyurethane elastomers guarantees the availability of the right material. Constant re-development and improvement of sensors have increased reliability and endurance beyond pipeline requirements. Short and flexible production time lines are guaranteed by in house production and assembly of the whole ILI tool including sealing elements and sensors. Prior to the inspection in question, ROSEN track records included already a whole range of successfully inspected long distance lines with a great variety of diameters from 12-in. with over 400 km; to 40-in. with over 1,000 km; to 42-in. with almost 1,200 km; to 48-in. with more than 1,000 km. These constant improvement efforts combined with the profound experience in long distance runs were the foundation to a successful inspection complying with service specifications and exceeding client expectations.
Outcome and consequences
Parallel to the study performed by ROSEN, the client filed an application to build a service platform halfway through the pipeline. In the following year, based on industry progress and also the aforementioned study, the client withdrew its provisional application to the government. In view of the local debate and concerns regarding such an installation, the client was pleased that technological progress obviated the need for a platform at mid-point of the scheduled pipeline route.
By spending a fraction of what the station would have cost, the client saved millions in planning and legal efforts as well as in construction. Not to mention the unmeasurable profit in public appearance and reputation gained by leaving the environment basically undisturbed.
Acknowledgment
Based on a paper presented at the Rio Pipeline Conference & Exposition, held Sept. 22-24, 2015, in Rio de Janeiro.
