M.M. Fliedner, D. Bevc - 3DGeo Inc.
B. Biondi, Stanford University
In complex velocity models, such as below rugose salt bodies, wavefield continuation migration usually is superior to Kirchhoff methods because of multi-pathing, sharp velocity contrasts, and the bandlimited nature of seismic wave propagation.
Wavepath tomography can build the velocity model in a way that is consistent with the migration operator. Instead of tracing rays to backproject residual velocities, a “wavepath” is constructed using the actual wavefield continuation operator to represent the wave propagation between surface source/receiver pairs and subsurface reflection points by multiplying impulse responses downgoing from the surface location and upgoing from the reflection point. The size of the inversion matrix is kept manageable by restricting the wavepath to the first Fresnel zone. The expense of computing a single wavepath kernel can be offset partially compared to ray tomography because fewer backprojections are necessary to sample the velocity model adequately.
Automated tomography
To streamline velocity modeling, an automatic method of signal detection was implemented that eliminates manual reflector picking by scanning the seismic data volume with prediction-error filters and automatically selects back projection points based on dip coherency and semblance strength. This can save months of time on a typical 3D seismic imaging project and shortens imaging turnaround while exploiting the full redundancy of the recorded data. Automation also reduces human bias and manual picking error while retaining the option to control quality and steer the solution. This approach is used with both standard tomographic ray-trace updating, and the wavepath method described here.
Selecting backprojection points independent of manually picked horizons involves calculating the best single dip in a window and the coherency of the dip by iterative application of plane-wave destruction filters. Points that satisfy specified levels of dip coherence, amplitude, semblance strength, and distance from other points and the edges of the image are selected as backprojection points. This method allows for an even distribution of backprojection points in the absence of strong geological boundaries (reflectors) that define the velocity model.
This subsalt back-projection point selection process of a 3D Gulf of Mexico data set illustrates the automatic pick approach:
1. Calculate dip and dip coherency at every model location.
2. Iteratively select a set of preliminary back-projection points that meet specified threshold criteria, taking into account amplitude, coherency, spacing, etc. Amplitude and coherence criteria are relaxed in each iteration to select the best points in each region.
3. Automatically pick residual velocities based on semblance.
4. The final point set is used as input into the wavepath tomographic inversion of the set of spatially-disconnected points.
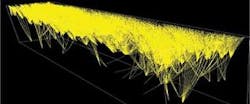
Sample of raytraced trajectories for backprojection in tomographic inversion.
Automatic migration velocity analysis method has been demonstrated on a range of 2D and 3D data sets, and is the basis for feeding analysis points into the wavepath updating approach
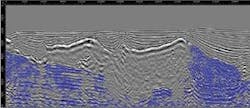
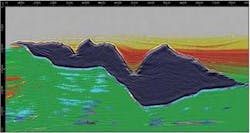
Sibsbee synthetic model. Starting velocity model (constant below salt) and backprojection points (color indicates velocity residual) overlain on seismic image.
null
Wavepath
Wavepath tomography is based on an idea by Woodward: instead of tracing rays to backproject residual velocities, a “wavepath” is constructed using the actual wavefield continuation operator to represent the wave propagation between surface source/receiver pairs and subsurface reflection points. Thus, multi-pathing, sharp velocity contrasts, and the bandlimited nature of seismic wave propagation can be modeled more naturally than with geometric rays.
To create a wavepath for a given velocity model, the impulse responses of the wavefield propagator are calculated for a source at the desired surface location (downgoing wavefield) and at the reflection point (upgoing wavefield) for one frequency. The two wavefields are then multiplied and the imaginary part of the product is retained.
By adding kernels for several frequencies, the seismic image bandwidth can be represented faithfully. For velocity model building, a single central frequency usually is sufficient.
To achieve a compact wavepath to minimize the size of the inversion problem, the kernel outside a volume like the first Fresnel zone is zeroed. This can be done by either thresholding the wavepath amplitude, tracking the central zero crossing, or using a pseudo-eikonal event tracker by treating the kernel as a pseudo-velocity field. The latter method works especially well in 3D.
Backprojection
The proper inversion weights for the tomographic velocity update are illustrated by the ray analogy. In the ray approximation, the inversion weightsaij of the inversion matrix A A∆s=∆π represent the length of raypath segments for each slowness cell traversed by a ray, the row sum is therefore equal to the ray length l. For a wavepath of unit amplitude everywhere over its support, the row sum equals its volume V. Consequently, the average weight is aij=l/V. Without changing the row sum, each individual weight can be modified according to the actual amplitude of the wavepath kernel.
Sigsbee subsalt velocity update
A tomographic update of the subsalt region in the Sigsbee velocity model is an example. The starting migration velocity is correct down to base salt and constant below. A fairly small number of backprojection points are selected based on reflection and semblance strengths, and reflector coherency. In contrast to infinitely narrow raypaths, the width of the wavepaths provides a natural regularization of the inversion. The updated velocity model is smoothed to compensate for gaps in backprojection point coverage. The result compares to ray tomography using the same residual data, but with 20 times the number of rays (normal and oblique incidence).
A further iteration brings the subsalt velocity model into agreement with the actual background model so that the flat subsalt reflector is positioned correctly and major subsalt faults and point diffractors are better resolved.
Subsalt hazard detection
As a test to combine these techniques, a 2D synthetic dataset provided by BP was used. The target is the narrow, low-velocity anomaly below the left salt body. For the starting model assume the velocities above salt and the salt bodies are known exactly whereas the velocity below salt is a simple gradient extended laterally from the center of the section. The ratio between starting and true velocity ranges from 0.76 to 1.57.
The synthetic data is migrated with a common-azimuth algorithm using a phase-shift downward continuation operator. Reflector continuity in the zone of interest is very poor, which is reflected also in the low semblance strength of the common image gathers (CIGs) below salt. Although the semblance peaks of the stronger subsalt reflectors are well focused, velocity updating based on semblance derived residual velocities is unlikely to work because the assumptions of single-value inversion (hyperbolic residual moveout over the CIG aperture) do not hold for such strong lateral velocity gradients and complicated overburden. The depth error (residual moveout or RMO) of reflectors on individual traces of the CIGs can be used to overcome the limitations of single-value residual velocity inversion.
Starting from the dip fields of stack and CIGs, automatic picks of backprojection points, reflector normal directions, and residual moveout. The dip field is calculated using the plane-wave destruction filter described by Claerbout. With the need to process potentially large prestack datasets, speed and robustness make this algorithm attractive.
The back projection data are fed into both ray-based and a wavepath-based tomographic workflows. The inversion contains about 22,000 back projection points and the back projection paths cover an offset range of 15 km (9 mi). The velocity model and hence the wavefields are sampled at 12.5 m (41 ft) vertically and 25 m (82 ft) horizontally.
Both methods pick up lowered velocities below the base of salt, but only the wavepath inversion comes close to resolve the magnitude near the salt base and the fact that there is a low velocity zone extending to greater depth. The location of the subsalt low velocity zone, indicative of overpressure, is well resolved.
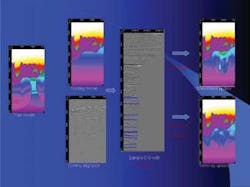
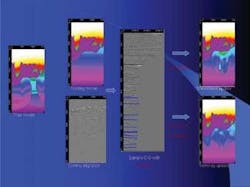
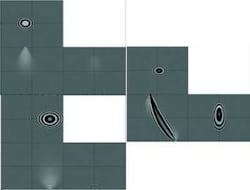
SEG-EAGE C3 velocity model (top left), single frequency wavepath example. Top right: downgoing wavefield. Bottom right: upgoing wavefield. Bottom left: multiplication of up- and downgoing wavefield (wavepath kernel).
In areas of complex velocity that challenge raytracing based velocity inversion methods, wavepath tomography offers a naturally regularized alternative consistent with the wavefield continuation migration method used to produce the seismic image.
In practice, always reserve wavepath tomography for the parts of the velocity model that cannot be obtained by ray tomography, and use ray tomography everywhere else. Submitting the wavepath and ray back projection equations together to the tomographic solver makes it easy to combine the approaches.
For example, in the Sigsbee case, the sedimentary velocities outside the salt body can be obtained easily from ray tomography. Even if the velocity field is very smooth and simple, as is the case of Sigsbee, wavepath tomography adds robustness to the inversion because it does not have a problem with erratic ray paths resulting from multiple internal or “underside” reflections generated by the high velocity contrast between the sediments and the salt body, or strong deflections of the ray path due to a rugose salt boundary.
Author’s note: Previous article taken from the DOT paper Wavepath Tomography for Subsalt Velocity Model Building.
