Completion technology could improve deepwater GoM water injection
Steven Fipke
Tendeka
In 2014, a major operator initiated a project in partnership with Tendeka to develop an innovative solution to improve the performance of deepwater Gulf of Mexico assets. The objective was to increase the life expectancy of Miocene and Lower Tertiary water injection wells, several of which had suffered a severe loss of injectivity within only a few years of completion.
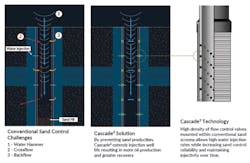
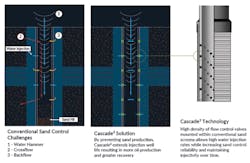
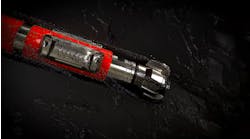
Cascade screen with intrinsic non-return valve technology. (All images courtesy Tendeka)
To initiate the project, an internal study compiled and analyzed the available data. The problem was identified as an accumulation of formation solids inside the lower completion; principally, fine matrix sand that had been pulled in from the reservoir. These solids are normally stationary during steady injection, but can be mobilized during shut-ins (maintenance, pump problems, environmental conditions) due to powerful transient flow effects such as back-flow, cross-flow, and even water-hammer. Eventually, solid fill accumulates to such an extent inside the lower completion that it can diminish the injection rates. At this point the operator must consider expensive options such as a side track or re-drilling a new deepwater injector well.
The obvious solution to this problem was to prevent the fine material from getting inside the completion. The challenge was sustaining high injection rates, with no loss of injection pressure or requirement for additional horsepower, and simultaneously stopping the formation material from entering the completion during a shutdown.
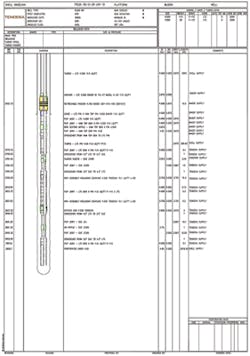
Permian basin SWD test well completion schematic.
Development of new sand control technology
Tubing-deployed injection valves and regulators have been available to the industry for many years, but a tubing-deployed device cannot address the problem of annular flow. The most damaging factor in solids production is likely cross-flow, wherein differently pressured injection zones can flow between layers inside the tubing/casing annulus. The solution must therefore be deployed as close to the sand face as possible.
To address the challenge of sand face injection flow control, Tendeka developed a new sand control technology,Cascade. This well screen, flow control completion system employs intrinsic check-valves to prevent any back-flow or cross-flow during shut-ins. Depending on well conditions it also limits the damaging effects of water-hammer: rapid, high-amplitude pressure cycles that can occur during a sudden stoppage of flow.
During the project’s R&D phase, the company used extensive laboratory testing, flow loop testing, and computational fluid dynamics (CFD) modeling to develop a series of non-return valve (NRV) prototypes. Each valve design was tested in-house and further qualified at third-party laboratories. The technology was designed to handle a variety of well conditions including erosion, plugging, temperature, and repeated checking cycles. Components were manufactured with high-alloy stainless steel and tungsten carbide to resist tortuous downhole conditions for up to 15 years. After a series of prototypes and design iterations over an 18-month period, a final design was qualified to reliably withstand thousands of pressure-checking cycles at 1,500 psi (103 bar), and up to 10,000 psi (689 bar) static differential pressure.
The three-year R&D project culminated with a field trial in March 2018. The system was originally developed for deepwater, offshore environments in the Gulf of Mexico, but it has also found useful applications in land-based injector wells with sand problems.
Pre-Gulf of Mexico field trial
A Permian salt water disposal well (SWD) was selected to test the system under the most adverse conditions: injection of untreated produced water. SWDs are common across West Texas and Oklahoma, disposing of up to 30,000 b/d of water (BWPD) per well.
The system was built on heavy walled 4-1/2-in. base pipe with an array of 630 NRV. The quantity of valves is a function of the expected injection rate. To minimize flow velocity, and hence erosional concerns, flow was limited to 40 BWPD per valve. The SWD selected for the field trial was approved for up to 25,000 BWPD, which corresponded to around 630 individual valves mounted in a spiral array into the base pipe. The size and positioning of the valves is critical to be able to mount them flush with the pipe so that a direct wire wrap screen can be manufactured over them without interference. However, the purpose of the field trial was to test the valves under the most challenging well conditions possible, so the test assembly was built without a sand screen to filter out any of the solids. This exposed the system to the worst-case injection scenario for any potential erosion or plugging problems to be observed.
The test well was completed with the new system installed permanently on 4-1/2-in. production tubing, below a hydraulic-set production packer. The system is designed to be deployed as the sand face completion, or inside an existing frac-pack. However, it can also be used on the production string to isolate flows below the production packer. For the test, a single injection zone was adequate to observe the effects of the non-return valves to achieve the following downhole test objectives:
• Observe and record water-hammer, with/without check valves
• Prove that check-valves can hold back pressure
• Observe for any evidence of plugging or erosion over an extended time.
The field trial was set up to test several aspects of functionality using multiple downhole memory gauges to record pressures at reservoir depth:
• Baseline step-rate injection test
• Step-rate injection test through valves
• Check test (bleed off tubing pressure, observe annulus pressure)
• Multiple hard shut-in tests to record water-hammer
• Longevity test, continued injection (three to six months).
The test assembly was positioned at the top of the injection zone, which was completed openhole with approximately 2,000 ft (609 m) of sandstone pay. A pre-perforated 4-1/2-in. liner was then run below the production packer down to total depth. With the tubing plugged below the test assembly, and pressure gauges set to record both the tubing and annulus pressures, the test was conducted by pumping down the tubing. A pump truck was brought to location to simulate injection, and portable tanks were tied into the flowline to take any returns.
This SWD was newly drilled and the formation was normally pressured, as no prior injection or water disposal had been done in the area. The well had been left suspended with kill weight brine and no pressure was initially observed on the wellhead. After displacing the tubing volume to lighter brine, a steady flow of produced water and about 300 psi (20.7 bar) of wellhead pressure were observed. Wireline was rigged up to set the pressure gauges and tubing plug. With the tubing plugged, all flow was diverted through the test assembly and a step-rate injection test was performed up to 10 bbl/min.
Evidence of functionality
Two hard shut-ins tests were conducted by quickly stopping the pump to record any fluid bounce and/or water-hammer on the downhole pressure gauges. The well was then opened to the surface tanks and tubing pressure was bled off to zero. No flow was observed into the tanks, which indicated that the check valves were effectively isolating the tubing from any back-flow.
The completion was equipped with a sliding side door (SSD) which was then opened to record a baseline test with direct communication to the formation. The same step-rate, shut-in and back-flow tests were recorded to have a baseline data set on the downhole pressure gauges.
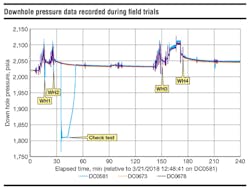
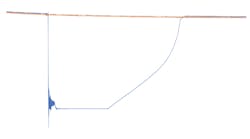
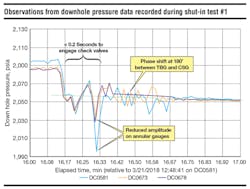
During the shut-in test, the downhole gauges recorded a drop of tubing pressure (blue trace) while the annulus pressure (grey and orange traces) remained constant, which indicated the test assembly was checking and holding pressure.
Upon closing the well at surface, the tubing and annulus pressure equalized over nine minutes. This confirms the NRVs do have a slow leak rate as previously observed in laboratory tests at <0.1 GPM (gallons per minute). The slope of the line indicates that the leak rate is somewhat slower under higher pressure differentials and becomes steeper (faster) as the pressure equalizes and the differential is reduced.
Looking closely at the hard-shut-in tests, it is difficult to see any clear evidence of water hammer because the sampling resolution of the downhole gauges was not fast enough to record it accurately. Based on the expected depths, rates, and pressures, well models indicated that water hammer frequency would be around 0.5 cycles/sec. Therefore, the downhole pressure data recorded at a sample rate of one measurement/sec does not give a full representation of the water-hammer waveforms.
The first of four shut-in tests were performed through the test assembly and several observations could be drawn:
During the initial cycles, the tubing pressure (blue) drops more than the annulus pressure (orange/gray). This indicates the point where the valves engaged to block annular pressure from entering the tubing
The amplitude of the initial cycles is 30-40 psi (2.07-2.76 bar), and quickly drops off to 10-15 psi (0.69-1.03 bar) for subsequent cycles, indicating that the tubing and annular pressures were isolated by the valves which dampened the pressure cycles
There is a ~180° phase shift between tubing and annulus pressure cycles, indicating that the tubing and annular pressures were isolated.
The main goal of the field trial was to prove that technology can work as designed at downhole conditions, checking against flow from the annulus to the tubing. Several attempts were made to test that hypothesis in the context of back-flow, cross-flow, and water hammer. Even though conditions were not ideal (lower than expected injection pressures), evidence of the technology’s check-valve functionality was clearly visible during the check tests. Flow rates and pressures were as expected when pumping through the test assembly and when the tubing pressure was bled off to zero, the NRVs prevented any back-flow and held annulus pressure constant. This observation verifies that the system performs as designed for downhole conditions.
Continued observation
As of July 2018, the SWD well has been put on full-time water disposal duty for several months. Future plans include running a set of downhole pressure gauges to observe the injection rates and pressures after a sustained period of injection. The well will continue to be checked periodically to determine if there is any impact on well performance related to the injection path through the test assembly.
Plans are currently in progress for the implementation of Cascade for a deepwater asset. Several offshore Gulf of Mexico fields are at risk of losing reservoir pressure support without sustained water injection, and the expectation is that this technology will improve injection rates over a longer time. The potential capex savings related to fewer injection wells drilled or re-drilled over the life of these offshore oil and gas assets are considerable. •
References
• J Charles & T Webb, Shell, and S Fipke, Tendeka, (2017). New Sand Screen Increases the Reliability of Sand Control in Water Injection Wells by Mitigating Common Failure Mechanisms. Society of Petroleum Engineers. 187103-MS
