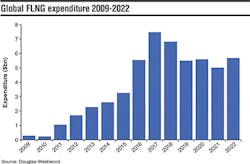
Despite near-term concerns, Douglas- Westwood’s World FLNG Market Forecast 2017-2022 expects capex on FLNG facilities to total $41.6 billion, with liquefaction units accounting for 59% of total spend.
Expenditure on floating import facilities is forecast to total $16.9 billion - a 220% increase compared to the 2009-2015 period. This is due to a large number of projects going ahead in countries that have never had floating import vessels before. In addition, a number of countries will increase their current capacity, as investors take advantage of the short lead times and the relocation flexibility of floating regasification units compared to land-based facilities.
The future of FLNG looks positive, due to the abundance of offshore gas reserves and the flexibility of LNG as a source of energy. Furthermore, the industry is moving away from its long standing supply contracting model, as companies now increasingly rely on the spot market to supply long-term LNG contracts to take advantage of low commodity prices.
- Mark Adeosun, Douglas-Westwood
New shale and oil sands are marginal sources of supply in 2020
At an average breakeven price of $32 /bbl, producing fields are the cheapest supply sources. Non-producing shale and oil sands are the marginal sources of supply in 2020, with high drilling/completion costs for the former and high capex/opex for the latter.
The Rystad Energy liquids cost curve is made up of nearly 20,000 unique assets and considers each asset’s breakeven oil price and potential production in 2020. The breakeven price is the Brent oil price at which NPV equals zero, and considers all future cash flows using a real discount rate of 7.5%.
Resources are split into two lifecycle categories as of present day: producing and non-producing (under development, discoveries, and undiscovered). For each lifecycle, associated costs are indicated such as opex and capex. Lifecycle categories are further split into different supply segment groups shown as colored boxes. The width of the boxes represents production in 2020 from a given supply source. The height of the boxes shows the range of breakeven oil prices that 60% of the production lies within.


