Kjell Lejon, Arlen B. Reme, Rolf B. Woster - Statoil
Oddmund Kvernvold, Larse E. Torbergsen - DNV
Sand production management involves different disciplines and departments. Multi-discipline approaches and processes were keys to maximize production within a sand producing environment. In a sand producing environment it is important to use all available data including that gathered through maintenance of equipment and inspections, to understand fully the consequences of sand production.
Snorre field
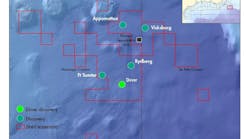
The Snorre field, operated by StatoilHydro ASA, is in block 34/4 and 34/7 of the Norwegian sector of the North Sea, approximately 150 km (93.2 mi) northwest of Bergen.
Snorre B is a combined drilling, production, and injection semisubmersible which has been in operation since 2001. The development consists of two subsea production templates and one injection template. Each production template has eight well slots and two manifold modules. The production from each well can be routed to Snorre B for processing via one of two 8-in. (20.3-cm) flexible production risers (PLs) or one 5-in. (12.7-cm) multiple purpose riser.
Production from each well has been limited by a maximum allowable erosion rate of 6 nm/hr recorded by the electrical resistance (ER) probes. This corresponds to the 1 mm (0.04 in.) erosion allowance given by pipe design, and expected field life time of 20 years based on the Plan for Development and Operation (PDO).
Each 8-in. (20.3-cm) flexible production riser arrives at theSnorre B riser balcony and expands to 10 in. (25.4 cm) hard piping upstream and downstream of a 6-in. (15.24-cm) angle style single-stage plug and cage choke, before reaching the production header. The inlet separator pressure is set at approximately 35 bars (507.6 psi)
The 5-in. (12.7-cm) multipurpose riser from each production template expands to 6-in. (15.24-cm) piping topside and is connected directly to the test or production header with no topside pressure control.
To maximize production and field recovery, Water Alternating Gas (WAG) injection strategy was implemented from day one to ensure reservoir pressure maintenance and effective reservoir sweep. Production has been characterized by early water and gas breakthrough.
Potential for sand production was considered low based on rock mechanical studies carried out prior to production start-up. Oriented/selective perforation was chosen to further minimize risk of sand production.
All wells except three producers are equipped with downhole instrumentation and control system (DIACS) for surface controlled steering of production and injection from/to individual reservoir zones. As of July 2007, a total of eight producers and five injectors were drilled and completed.
Original sand management philosophy
The original philosophy for controlling the risks associated with sand production relied on the subsea ER probes. For redundancy, two ER probes, each with four erosion elements, were installed on all production wells.
Probe B is approximately 20 cm (8 in.) downstream and 90° to probe A. The consequences of this design are discussed later.
In the original installation, the thickness of the erosion elements for probes A and B was 0.2 mm (.008 in.) and 0.3 mm (.012 in.) respectively. The erosion elements fail at typically 70% of the element thickness.
Based on the output from the ER probes, erosion rate was limited to 6 nm/hr. Over short time periods, typically during well start-up, higher erosion rate was expected. It is important to note that the chosen sand monitoring strategy was based on the presumption that the four erosion elements on each ER probe would experience the same erosion velocity. If one or more elements failed, the remaining elements were used to measure the average erosion rate on the probe, but still using 6 nm/hr as operational limitation. Further, it was anticipated that the output from the ER probes, i.e. 6 nm/hr, represented the most critical erosion in the piping system. In the design, it was also anticipated that ER probe B would exhibit the same response to sand production as probe A.
Considering maximum erosion of approximately 70% of the element thicknesses before failure, the erosion probes are expected to wear out after three to four years in operation, given a continuous erosion rate of 6 nm/hr. This reveals a major shortcoming of the original sand management philosophy relative to the ER probe design specifications. In addition, the ER probes cannot be repaired or replaced unless pulling the entire XMT.
Operational experiences 2001-2005
The overallSnorre B production history from start-up of production until year-end 2005 indicated a trend of increasing GOR and WC. Operating a field is focused on maximizing both short- and long-term oil and gas production. However, in terms of fluid velocities throughout the production system, the understanding and focus may be quite different, hence high erosion potential may not be revealed.
As part of DNV ASR (Acceptable Sand Rate) strategy, a ranking system to evaluate erosion potential based on velocities was developed, indicating that parts of theSnorre B production system has experienced high erosion potential.
During the maintenance shut down in May 2005, all four topside production chokes were removed due to re-routing of the piping system. As part of this operation, the chokes were split and inspected, revealing significant erosion of the entire gallery circumference and height, with a maximum wall thinning of 10-15 mm (0.39 – 0.59 in.) for both the PL1 and PL2 choke.
The experienced erosion in the choke gallery was much higher than expected considering the production history and estimated sand production from start-up of the field. The typical production data were also introduced to the choke guideline system developed by DNV, which gave far less erosion rates than that seen on inspection.
The experiences from using ER probes are summarized as follows:
Findings and observations
Based on the findings and observations, a number of concerns were identified:
- Erosion elements on most of the wells due to be worn out
- Condition of subsea production piping and choke with respect to erosion damages
- Further erosion development in topside chokes
- Extent of sand production from individual wells.
To meet these concerns it was decided to implement a sand production management project aimed to:
- Improve understanding of erosion mechanisms throughout the system using Computational Fluid Dynamics (CFD) simulations
- Establish and carry out inspection programs to meet requirements related to safe sand production
- Establish erosion monitoring system to enable full overview of fluid velocities and erosion potential throughout the production system
- Provide input to future sand monitoring system and steering criteria with respect to sand production.
Opportunities identified
Due to low accessibility of subsea equipment (i.e. chokes, erosion probes, etc.) for inspection purposes, the project focused on possibilities emerging through failure of subsea equipment, planned well workovers, etc. The following opportunities were identified and carried out:
- Inspection of choke insert and body for well C-2H due to problems with choke actuator
- Inspection of XMT flow loop, choke, and ER probes following workovers on well C-4H and C-5H
- Inspection of subsea manifold piping during workover operation on well C-5H.
For ordinary pipe bends and target tees, DNV RP O501 applies. However, the production system from subsea to topside involves complex isometrics and geometries. A comprehensive analysis of the production system from the subsea XMT to the topside production manifold was conducted to identify the most critical components. The system response in terms of erosion rates with varying production conditions was assessed through empirical erosion models and additional detailed CFD simulations. The results were compared with inspection data.
Erosion monitoring system
To improve the understanding and implications related to sand production, an erosion monitoring system was developed. This system enablesSnorre B to store, use, and illustrate the following data:
- Historical production for all wells
- Routing of production on well level to the individual production lines
- Flowing velocities throughout the system from upstream subsea choke to inlet and test separator
- Erosion velocities at chosen locations based on erosion models
- Predicted production profiles to estimate future erosion potential and erosion rates.
The system is a useful tool in multi-discipline discussions of inspection strategy, well planning, production steering, and process optimization.
Sand monitoring and steering criteria
The consequence of losing most of the readings from the erosion probes was losing the monitoring of sand production from individual wells. Because the ER probes were not retrievable unless the XMT was pulled, the consequence of reinstalling them was significant. It was decided to install acoustic sand detectors on all four production lines and on the two multipurpose lines. The acoustic sand detectors were chosen due to short installation period and no need for production shut down. In addition, good experience with the same type of instrumentation was reported from other Statoil fields. The acoustic detectors were installed October 2006 and the data is available in real time.
To keep sand production under control and to reduce risk of unacceptable erosion, updated steering criteria have been established as follows:
- Maximum flowing velocity downstream the subsea choke [5-in. (12.7-cm)] piping should be kept below 10 m/s (32.8 ft/s) if sand production is detected. However, with no or insignificant sand production, the flowing velocity can be increased to maximum 15 m/s (49.2 ft/s)
- If significant sand production is detected during normal operation, sand production should diminish to acceptable levels within six hours. Otherwise production will be choked back
- If significant sand production is detected during well start-ups, sand production should diminish to acceptable levels within 12 hours. Otherwise production will be choked back.
To improve sand monitoring subsea acoustic sand detectors were installed. As the flow loop between the subsea choke and production manifold is thermally insulated, the subsea acoustic sand detector can be installed only when running new XMT’s. The first installation was done on well C-5H in May 2007. This data indicated the importance of multiple measurements for better understanding and steering of sand production.
Acoustic sand detectors will be installed on all future wells to optimize sand monitoring. Additionally, subsea ER probes are planned. The final conclusions have not been reached yet, but likely there will be only one ER probe installed and the element thickness will be increased to 1 mm (0.039 in.). Further, the location most likely will be moved to maximum 1 m (3.28 ft) downstream of the choke to achieve more homogenous distribution of sand particles and to minimize negative effects related to piping layout.


