EIA: The top oil and gas producer in 2016, US to ramp up output for 2017
Offshore staff
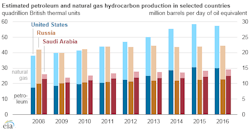
WASHINGTON, D.C.–According to the US Energy Information Administration, the US remained the world’s top producer of petroleum and natural gas hydrocarbons in 2016 for the fifth straight year, despite production sdeclines for both petroleum and natural gas relative to their 2015 levels.
TheUS has been the world’s top producer of natural gas since 2009, when its natural gas production surpassed that of Russia, and it has been the world’s top producer of petroleum hydrocarbons since 2013, when its production exceeded Saudi Arabia’s.
For the US andRussia, total petroleum and natural gas hydrocarbon production in energy content terms is almost evenly split between petroleum and natural gas, while Saudi Arabia’s production heavily favors petroleum. Total petroleum production is made up of several different types of liquid fuels, including crude oil and lease condensate, tight oil, extra-heavy oil, and bitumen. In addition, various processes produce natural gas plant liquids (NGPL), biofuels, and refinery processing gain, among other liquid fuels.
In the US, crude oil and lease condensate accounted for roughly 60% of total petroleum hydrocarbon production in 2016. In Saudi Arabia andRussia, this share is much greater, as those countries produce lesser amounts of NGPL, and they also have much smaller volumes of refinery gain and biofuels production.
US petroleum production fell by 300,000 b/d in 2016, as a result of relatively low oil prices.
With rapid growth in natural gas production through 2015 and a very mild 2015-2016 winter that reduced demand for natural gas as a heating fuel, average US natural gas prices in 2016 were at their lowest level since 1999. Despite a modest recovery in prices later in the year, natural gas production decreased by 2.3 bcf/d in 2016.
Russian hydrocarbon production has been rising as capex on exploration and production increased. Russia also has favorable tax regimes and exchange rates (Russian company expenditures are in Russian Rubles, but oil sales are in US dollars) that resulted in record levels of Russian petroleum production in the second half of 2016. Russian natural gas production also rose in 2016, in part to meet growth in European natural gas demand.
In 2016, natural gas demand increased by an estimated 6% in European countries that are members of the Organization for Economic Cooperation and Development.
In contrast to past actions to raise or lower oil production levels to balance global oil markets, Saudi Arabia did not reduce its petroleum production between late 2014 and 2016 in an effort to defend its market share, even as prices remained low and world oil inventories continued to grow. In 2016, Saudi Arabia’s total petroleum and natural gas hydrocarbon production rose by 3%.
In the EIA’s June Short-Term Energy Outlook, US petroleum and other liquid fuels production is expected to increase, reaching 15.6 MMb/d in 2017 and 16.7 MMb/d in 2018, up from 14.8 MMb/d in 2016.
The same report, released yesterday, forecasts Russian liquid fuels production to average 11.18 MMb/d over 2017 and 2018, close to the 2016 production of 11.24 MMb/d.
The STEO provides a production forecast for members of OPEC as a whole rather than for individual OPEC countries. OPEC liquid fuels production, which was 39 MMb/d in 2017, is forecast to be 39.2 MMb/d in 2017 and 39.9 MMb/din 2018.
This outlook takes into account recent agreements among OPEC member countries, as well as pledges by key non-OPEC producers, including Russia, to restrain production. At its May 25 meeting, OPEC agreed toextend the production cuts it originally announced in November 2016 through March 2018.
Also in the June STEO, theEIA updated on its average monthly per-barrel prices. North Sea Brent crude oil spot prices averaged $50/bbl in May, $2/bbl lower than the April average. EIA forecasts Brent spot prices to average $53/bbl in 2017 and $56/bbl in 2018. West Texas Intermediate (WTI) crude oil prices are forecast to average $2/bbl less than Brent prices in both 2017 and 2018. NYMEX contract values for September 2017 delivery that traded during the five-day period ending June 1 suggest that a range of $39/bbl to $64/bbl encompasses the market expectation for WTI prices in September 2017 at the 95% confidence level.
06/07/2017


