Vidar Furuholt
EMGS
The exploration industry will pay for information to reduce uncertainty. Marine controlled-source electromagnetic (CSEM or simply EM) methods promise such information. But, how much should you be willing to pay for it?
Value of information (VOI) is designed to address the question of how much additional data is worth in a decision making process. Bratvold et al. provide a review of the use of VOI in the oil and gas industry in general. Buland et al. look specifically at VOI for CSEM data, and demonstrate the value of EM data for making single drill-or-drop decisions.
Making single drill-or-drop decisions is the typical use for EM technology. Lately, however, a clear, growing trend of using EM data in portfolio ranking is emerging. In August 2011, Petrobras signed a $90-million contract with EMGS for a long-term EM campaign. This follows a $150-million contract in 2010 with PEMEX. Rocksource, a Norwegian based operator, recently showed how consistent application of EM data in its portfolio management over a period of several years has been a benefit (Stefatos et al.).
Evidently, these and other exploration companies see value in applying EM on a portfolio level. As with the drill-or-drop application, it is of interest to quantify this value and to understand its main drivers. VOI analyses of EM data applied to historical and synthetic portfolios representing a range of likely exploration settings show that portfolio ranking significantly increases drilling success and adds value that exceeds its cost.
Before creating a VOI framework to rank prospects in a portfolio, the concepts for assessing the VOI in a drill-or-drop setting should be evaluated. Buland et al. does this.
The expected value (EV) of an undrilled prospect is commonly defined as
where Pg is the chance of geologic success, V is the value of reserves in place (if any) and C is the cost of drilling.
Acquisition and analysis of EM data gives new information about the chance of success and the size of reserves, which leads to a new EV. The impact of EM information is limited to its effect on Pg ; its potential impact on V is ignored. Using Bayes' rule with the new EM information, the chance of geologic success is
or
for positive and negative EM results, respectively, whereS is the probability that the EM result will correctly predict a given drilling result. This determines the amount by which Pg is allowed to change with the introduction of EM data. In line with Buland et al., this factor is called the prediction strength of EM.
If the cost of the EM survey is Cem, the updated EV of the prospect is
where Pg combines the two terms in Equation 2 weighted with probability of occurrence. The risk-neutral VOI in a drill-or-drop decision is the difference in the prospect's EV with and without EM data. If the V and Care unchanged, the drill-or-drop VOI is
The VOI measure varies with initial Pg and V. Although this is a widely accepted measure of the VOI in drill-or-drop decisions, it does not reflect the full VOI for a portfolio.
Companies have finite budgets, so the correct decision is not simply "drill all wells with positive EV", but rather "drill the wells that maximize portfolio EV." Furthermore, even for drill-or-drop decisions, the formula above is valid only for a risk-neutral decision, i.e., a decision that looks atEV and not at uncertainty. A risk-neutral decision has no preference between a $1 note and a lottery ticket with a possible prize of $100 and a 1% chance of winning. In practice, the portfolio option with the lowest risk is often preferred.
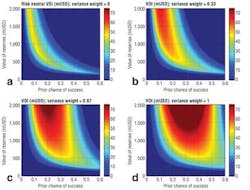
So, data can add value by reducing risk as well as by affectingEV. On this basis, several alternative measures for the drill-or-drop VOI that account for variance (the statistical expression of risk) have been proposed (Lerche and MacKay). Each measure could be said to represent a separate corporate philosophy toward investment risk. For example,
wherev is a function of variance.
The risk-neutral formula is a special case of where the weight on the risk factorv is zero. The accompanying display shows a sequence of related VOI measures with gradually decreasing risk tolerance, from risk neutral (top left) to the level suggested by Lerche and MacKay (lower right). The other two results use intermediate weights for v.
VOI in a drill-or-drop scenario strongly depends on the measure used, and the measure chosen must incorporate a realistic expression of the company's risk tolerance. Consideration of the statistical trends through the analysis of the VOI for portfolios enables the risk element to be incorporated. This makes it possible to obtain more robust and informative VOI assessments for the long-term use of EM data in decision making that an analysis based on drill-or-drop decisions.
VOI for drilling campaigns
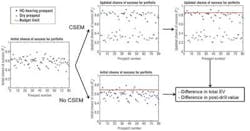
Portfolio ranking differs from the traditional single-prospect drill-or-drop scenario in that EM data are acquired for a series of prospects to assist in identifying the best prospects. A simple ranking and drilling-selection model assesses how EM data influence portfolio ranking. This model starts with a set of prospects and an initial distribution of Pg and, for simplicity, uniform V and C. There is a fixed drilling budget. The prospects with highest EV are selected for drilling (B = number of these prospects). Uniform V and C mean making the section based on Pg , with those prospects above the red line selected. The sum of the individual values for EV for the drilled prospects gives the total EV for the drilling campaign without EM data.
Bayes' rule updates all the prospects with EM results, either positive or negative (assuming that there are no inconclusive EM results). A new set of prospects is selected for drilling within the fixed drilling budget, and those individual values forEV are summed to give a new total EV for the drilling campaign with EM data considered. In this model, EM data is acquired on all the prospects in the portfolio, regardless of the initial Pg and whether or not each is drilled.
The difference inEV for the two scenarios is a measure of the EM data VOI for the drilling campaign, and is analogous to drill-or-drop VOI measures. This difference comes from the revised Pg assessments, the introduction of Cem and the change in selected prospects when EM data is included. This a priori VOI can be calculated before drilling.
If we know which prospects are hydrocarbon filled and which are dry (either by design for synthetic portfolios or, retrospectively, for portfolios of drilled prospects), it is possible to calculate the difference in the post-drilling value generated by the drilling campaign with and without EM information. This difference is a measure of thea posterioriVOI for EM data, and is more accurate because it incorporates drilling results.
IfD is the number of discoveries made without EM data and Dem is the number with EM data, then the a posteriori VOI is the difference in the post-drilling value of the drilling campaign minus Cem on all prospects:
The example portfolio used herein is an actual global database of prospects where both EM results and drilling results are available (Hesthammer et al.). By treating this database as a portfolio, it is possible to calculate both the a priori and the a posteriori VOI for different outcomes of an imagined ranking process.
Unfortunately, the database does not have information about the initial chance of success for the prospects. This study assigns a pseudo-random initial Pg value to each prospect sampled from a triangular probability distribution with a mean equal to the discovery rate of the database (61%).
The high discovery rate is hardly representative for most exploration portfolios. It reflects the fact that these prospects were all deemed promising enough to be drilled. However, this has no consequence for the illustration of how to calculate the VOI.
EM predictions and prediction strengths
To analyze the value of EM data, a quantifiable EM response marker and a threshold for this marker above which the survey result is deemed positive is required. Hesthammer et al. chose a normalized anomalous response (NAR), a characteristic value of the magnitude of the EM response in the target zone normalized against a background response. Although this analysis does not represent a modern EM interpretation workflow, the results are useful for illustration.
A NAR was calculated for each prospect in the portfolio. A threshold NAR value of 1.15 was chosen. Above that, a prospect is defined as EM positive. A successful well in an EM-positive target gives a true-positive EM case. Likewise, a dry well in an EM-negative target yields a true-negative. A mismatch between EM and drilling results yields a false positive or negative. In this way, it is possible to calculate four empirical prediction strengths for the same dataset, where, for example, the true positive prediction strength,Strue positive, is given by
The definition ofStrue positive is not the chance of making a discovery given a positive EM result. Rather, it is the chance of a positive EM result given a hydrocarbon-bearing prospect. This definition is dictated by Bayes' theorem. It is easy to achieve Strue positive = 100% for any given portfolio by declaring all prospects EM positive. However, this means all dry prospects are also identified as EM positive, with the implication that Strue negative = 0. Therefore, the four empirical S values are interdependent and defined by the EM response marker and its threshold.
A low NAR threshold gives a highStrue positive at the expense of a low Strue negative. Conversely, a high threshold gives a bias toward Strue negative at the expense of Strue positive. Therefore, there is a trade-off between overlooking discoveries and erroneously identifying dry prospects as EM positive. This trade-off must be addressed, regardless of the choice of EM response marker.
The optimal threshold is between the extremes, but exploration companies with different risk tolerances and portfolios, both in terms of geology and economics, are likely arrive at different optima. For the example portfolio, a NAR threshold value of about 1.3, near the crossing point of the positive and negative curves, would be a good choice. This crossing point is also the only choice of threshold where the assumption of a singleS is valid. Also, the criteria and threshold for classifying a well as discovery or dry will have an impact similar to that of the EM response threshold on the EM S.
When distinguishing between ana prioriand an a posteriori VOI, there is a further ambiguity in defining S:
- Historical performance of EM predictions when compared with drilling results
- ExpectedS of a survey that has not yet been performed
- Influence that the EM information is allowed to have on the pre-drill update of Pg for an individual prospect.
The first of these calculated retrospectively for a given portfolio, is the portfolio's historical EMS value and determines the a posterioriVOI. It can be assessed retrospectively like in the example portfolio, and can be used as input in future risk-ranking processes.
The second affects the VOI assessment before drilling, and, hence, the decision whether or not to acquire EM data. The value ofS must be chosen individually for each survey on the basis of sensitivity analysis, geological considerations, and experience.
The third type ofS, the EM weight, is used in the Bayesian update of Pg and affects the selection of wells for drilling. EM weight is an essential parameter when using EM data to rank prospects. It controls the emphasis put on EM data relative to other geophysical data for each individual prospect. The historical and expected S values and the EM weight may all be different, and all three have an impact on the ultimate success of any drilling campaign where EM technology is applied.
Calculating the VOI
For consistency with previous studies (Hesthammer et al.), a NAR threshold for EM success of 1.15 is adopted. With the corresponding S values, the updated Pg estimates after EM are
for EM positive and negative prospects, respectively.
Thea priori and a posteriori VOI for this portfolio now can be calculated using this model and method and varying the unknown parameters, such as the drilling budget and the V per prospect. The a priori VOI varies smoothly across the field, with a linear increase in V (vertical axis). The cost of running EM surveys on all prospects is likely to be unrecoverable if the number of wells to be drilled is too small. When drilling budgets get very large, the VOI decreases because little is gained by a more careful selection of prospects. For the a posterioriVOI, the picture is less smooth because of the statistically low number of prospects. However, the same linear increase withV and the same peak for a drilling budget of about 50 wells are seen.
A prominent feature is the high post-drill VOI at low budgets, which deviates from thea priori, or expected, VOI. This results from improving the success rate among the first few wells with just one or two additional discoveries. This significantly lifts the value of these small drilling campaigns. It can be argued that this effect requires some luck, but tests show it is a robust feature and it is probably more accurate to regard it as a discrete effect in small portfolios. The effect is not captured by the a priori VOI, because this measure only works on probabilities.
Overall, results indicate that the systematic application of EM information on the prospects in the database would provide significant value for almost any realistic variation of the unknown parameters.
Finding the expected VOI before surveying
The database example demonstrates that the drilling budget and reserves value per prospect are two parameters with a strong influence on the VOI. Other influences are the initial distribution of Pg , the EM prediction strength, C, and Cem. When analyzing the a priori VOI, some or all of these parameters may be unknown or uncertain. For a complete view of the likely VOI for a portfolio, the uncertain parameters can be varied within ranges and the VOI can be calculated for each parameter combination.
A further degree of uncertainty is introduced in the VOI analysis of undrilled portfolios because the contents of the prospects are unknown (i.e., whether or not the prospect will be a discovery or dry). The best option is to analyze the asymptotic behavior of the VOI for large portfolios assuming a predetermined success rate. The asymptotic values represent the expected VOI if EM data were applied systematically to portfolios with infinite prospects. As this analysis does not include information about portfolio size, the resulting measure is the VOI per well drilled, rather than the total portfolio VOI. In the analysis of the expected VOI, the distinction between thea priori and the a posteriori VOI converge to the same solution.
Conclusions
It is possible to calculate the VOI for EM data when applied to portfolio ranking. Analyses of an historical dataset and synthetic portfolios demonstrate that applying EM data consistently in portfolio ranking increases a drilling campaign's chance of success. Importantly, the expected value of EM data can be calculated for undeveloped portfolios where EM data acquisition is considered. The results show a 10- to 20-fold higher ROI for EM surveying.
References
1. Bratvold, R. B., Bickel, E. J., and Lohne, H. P.: "Value of Information in the Oil and Gas Industry: Past, Present, and Future", SPE 110378, SPE Annual Technical Conference and Exhibition, Anaheim, California, USA, 11–14 Nov. 2007.
2. Buland, A., Løseth, L., and Røsten, T.: "The Value of CSEM Data in Exploration," Paper C006, 72nd EAGE Conference & Exhibition, Barcelona, 14–17 June 2010.
3. Ellingsrud, S., Eidesmo, T., Johansen, S., Sinha, M.C., MacGregor, L.M., and Constable, S.: "Remote Sensing of Hydrocarbon Layers by Seabed Logging (SBL): Results from a Cruise Offshore Angola," 2010, The Leading Edge, 21(10), pp. 972–982.
4. Hesthammer, J., Stefatos, A., Boulaenko, M., Fanavoll, S., and Danielsen, J.: "CSEM performance in light of well results," 2010, The Leading Edge, 29(34), pp 258–264.
5. Lerche, I., and MacKay, J.: Economic Risk in Hydrocarbon Exploration, 1999, Academic Press, pp. 211–226.
6 Lindom, B., Lie, J., and Ridyard, D., "Electromagnetic Prospect Scanning - Seabed Logging Moves from Risk Reduction to Value Creation," SPE 108631, International Oil Conference and Exhibition, Veracruz, Mexico, 27-30 June 2007.
7. Mohr, J., Guargena, C., Sorensen, S., Christensen, O., and Tah, B.T.L.: "Seabed Logging Acquisition as a Tool in Exploration Decision-Making" 2008, The Leading Edge, 27(4), pp. 532–536.
8. Stefatos, A., Hesthammer, J., Sperrevik, S.: "CSEM Led Exploration in the Barents Sea" Paper D012, 73rd EAGE Conference and Exhibition, Vienna, 23-26 May 2012.
Offshore Articles Archives
View Oil and Gas Articles on PennEnergy.com
