Annabel Green
Neil Bowden
Tendeka
Martin Halvorsen
Statoil
Troll is a large oil and gas field discovered in 1979 in the Norwegian North Sea, 80 km (49.7 mi) northwest of Bergen. It comprises the Troll East, Troll West Oil and Troll West Gas provinces, and contains around 40% of total gas reserves on the Norwegian continental shelf.
Gas production started from the Troll A development in 1996. The gas reservoirs are 1,400 m (4,593 ft) below mean sea level. In 2005, a major facilities expansion was conducted to support the installation of two gas compressors to maintain production against a declining reservoir pressure. Two further compressors are being installed that will be operational in 2015.
Modeling decline and performance is critical to maintaining efficient production and recovery, with topsides add-on projects requiring significant advanced planning. In this regard, downhole data is invaluable and would typically be provided via permanent downhole gauges. However, given the extended lives of Troll-A's 39 gas production wells, so-called "permanent" monitoring solutions do not offer the required longevity in service. Statoil is therefore looking to evaluate and trial alternative intervention-based options.
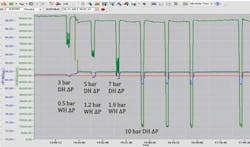
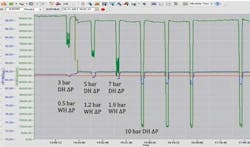
First pressure pulse sweep as recorded on surface sensors. (All images courtesy Tendeka)
Click image to Enlarge
The 31/6-A-35 well was first completed in 1996 with a gravel-packed lower completion and a 75⁄8-in. 13% Cr upper completion (a permanent downhole gauge was not included). Due to demand variations, output from the well varies markedly. In winter, gas production peaks at 2.4 MMcm/d (84.7 MMcf/d), dropping to 0.8 MMcm/d (28.25 MMcf/d) during the summer. Small amounts of water and gas condensate are also produced from this well, with solids content but no scaling issues.
Earlier this decade Statoil opted to install a wireless gauge in the well with a pressure pulse telemetry system. The gauge operates by transmitting compressed data from a quartz pressure sensor to the surface via a pressure pulse telegram. Existing wellhead sensors can be used to detect the pulses.
The pressure pulse is generated by choking flow at the downhole tool until this is detected at surface as a small reduction in the flowing wellhead pressure. The wireless gauge is deployed on a conventional wireline retrievable plug or lock mandrel so that it hangs within the production tubing. Under normal flow conditions the produced fluid travels up the annulus between the wireless gauge and the production tubing until it enters the gauge through a series of ports at the top of the tool.
Well pressure and temperature data from the quartz transducer is monitored constantly to detect events such as well shut-in and the re-start of production/injection. If flowing conditions are detected at the start time for the telegram to be issued, the gauge will transmit a single pressure and temperature data point along with information on the source of the data by creating six pressure pulses, detected by the wellhead sensors.
To create a pulse, a pressure reading is recorded and the choke plug is moved into the choke cage: this reduces the flow area, and induces a pressure drop. The choke plug position is then held for five minutes, after which the choke plug is allowed to retract. The hydraulic actuator does not hold pressure and as this bleeds off, spring force returns the piston to the flowing position.
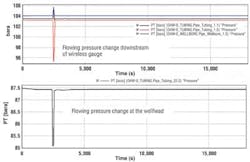
Transient flow modeling results for a 7.5-bar pulse at the tool.
Click image to Enlarge
Previous wireless gauge installations deployed a "percentage position hold" method for sending a pulse to the surface. This entails programming the gauge to move to a fixed position each time it generates a single pulse. However, operating conditions for the Troll A-35 well vary throughout the year, so the same choke position is not always optimum for transmitting a signal that is adequate for detection. At times the well may be in a condition in which the pulse is not detectable.
A method of creating a pulse using pressure regulation was therefore developed for A-35. Prior to a pulse, pressure is measured and the gauge then chokes until the chosen pressure drop is attained. If the pressure drop is not achievable, the gauge goes to a maximum default position to prevent the well from being closed in. When regulating on pressure, the choke valve automatically adapts to any changes in the production rate – if this decreases, the choke travels further while if the rate decreases, it moves less.
Click image to Enlarge
Toolstring components
The wireless gauge was installed in the A-35 well in November 2011, and fitted with two sulfuryl chloride lithium battery units. A roller stem was made up to the bottom of the tool to aid deployment through the 7 5/8-in. x 7-in. completion cross-over – a simple cross-over was applied to attach the wireless gauge to a conventional wireline retrievable bridge plug. The slickline-deployed toolstring comprised a timer-activated hydrostatic setting tool, spang jar, and accelerator, with the wireline-retrievable bridge plug set at 1,450 m (4,757 ft) MD, 95m (312 ft) MD above the top of the reservoir at roughly 40° deviation.
The wireless gauge was programmed to start operating 20 hr after the battery connector was installed, allowing sufficient time to pick up the assembly, run in hole, set the plug, pull out of hole with the running tool, and restore the well to production. First operation performed by the gauge was a pulse test sweep which involved sending a sequence of pre-programmed pulses with different amplitudes. This was designed to determine whether the programmed pulse size for the daily telegram was adequate – if not, the gauge can be reprogrammed with a different telegram pulse size.
Recommended downhole pressure drop for pressure regulation purposes was 5 bar (72.5 psi), to generate a pressure drop greater than 1 bar (14.5 psi) on surface. A 9-bar (130.5-psi) pressure drop was selected for the daily telegrams to ensure a sufficient signal on the surface. The test sweep was chosen to cover a range of pressures around this value (3-21 bar, or 43.5-304.5 psi). During the test sweep the 7-bar (101.5-psi) downhole pressure drop generated a 1.9-bar (27.5-psi) wellhead pressure drop on the surface. However, the 10-bar (145-psi) downhole pressure drop proved unattainable, and the choke was therefore closed to the programmed maximum travel.
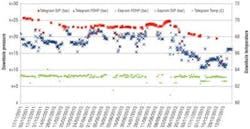
Plot shows transmitted and recorded downhole pressure and temperature data.
Click image to Enlarge
There were concerns that the large downhole pressure drop and the resultant impact on production – followed by rapid re-opening of the choke – could lead to formation damage and rock failure. With the 3-bar (43.5-psi) downhole pressure drop a production increase of 21,590 cu m/hr (762,444 cf/hr) was observed over 10 seconds. In response, the gauge was re-programmed to the minimum detectable pulse size using a 1.5-bar (21.7-psi) downhole pressure drop for the daily telegrams. A short sweep of 0.5, 1, and 1.5-bar (7.2, 14.5, and 21.7 psi) downhole pressure drops were used to test the new gauge program, with observation of the third pulse showing a clear signal that a 1.5-bar setting was adequate.
Modeled vs actual transient response
Before a gauge is installed, feasibility of communication within the well is confirmed and the size of the downhole pulse determined by modeling the well using transient multi-phase simulation software. A model of A-35 was built up from trajectory data, casing/completion characteristics, fluid properties and well conditions during production. A 1-bar pressure drop was proposed on the surface for detection. The aims of the software simulation were to calculate the required downhole pressure drop to realize this scenario, and to determine whether the well was stable when attempting to achieve this pulse size.
A choke valve placed in the planned location of the gauge was simulated to choke to a near-closed position for two minutes. Results showed a baseline pulse size on surface of 2.5 bar (36 psi) achieved with a pressure drop downhole of 7.5 bar (108.8 psi). The simulation was then run multiple times at different choke positions to elucidate which downhole pressure drop would generate 1 bar downhole pressure drop at surface – 5 bar (72.5 psi) was the outcome. In addition, multiple pulses were simulated together to determine the minimal time between pulses for production to stabilize. This exercise led to a 10-minute gap being chosen for the test sweep.
Choke housing and choke plug post-A-35 operation.
When comparing the model to the actual test sweep results, there was reasonable correlation with the 5-bar downhole pressure drop in the test sweep leading to a surface pressure drop of 1.2 bar (17.4 psi) as well as stable production after the pulse. The 7-bar (101.5-psi) downhole pressure drop pulse created a 1.9-bar (27.6-psi) wellhead pressure drop on the surface and was close to the simulation result of a 2.5-bar (36-psi) surface drop from a 7.5 bar downhole pressure drop. Production stabilized rapidly after each pulse, as indicated in the simulations for 5 bar and 7.5 bar downhole pressure drop pulses. The close match between the modeled and actual data has proven the feasibility of using transient simulation software to confirm the telemetry prior to running the gauge.
Flaw identification
On Feb. 6, 2012, two and a half months after the first telegram, an event led to significant choking of the well, as evidenced in the fifth pulse in the daily telegram. It was clear from the data that the gauge had choked to its pre-programmed maximum position rather than creating a 1.5-bar (21.7-psi) downhole pressure drop. Seven days later the same pattern was observed, this time with the gauge moving to the maximum choke position on the third pulse. On both occasions the tool subsequently operated correctly.
Analysis led to the identification of an error in the firmware. Bench tests confirmed a condition under which power to the pressure sensor was not transmitted quickly enough to provide a valid reading. The firmware upgrade that followed was tested to rectify the problem, but this could not be applied in the downhole tool without retrieving the gauge. An automatic detection and recovery system was therefore implemented, designed to detect the issue by checking for a differential pressure greater than the normal pulse size, leading to an automatic wellhead shut-in followed by a controlled opening of the surface choke.
The wireless gauge relayed its final telegram 428 days after the original installation. The initial battery calculation indicated the tool would function for 347 days, assuming a telegram was sent on a daily basis. As the well temperature was low, self-discharge of the batteries was minimal and the telegram actuation dominated tool life. The wireless gauge transmitted a total of 354 telegrams, with battery depletion considered the most likely cause of transmission ceasing. The gauge remained in the well for a further three months, in the fully open position, before being retrieved on slick-line. A review of its diagnostics data and function testing in a laboratory confirmed that the tool remained fully operational and that the batteries had been discharged in service. No erosion, debris ingress or appreciable wear were observed.
Weekly data interpretation had been performed through remote access of the operator's data management system. The start time for each pulse was manually picked from the tag for the wellhead transducers and entered into an interpretation program, with results relayed to the operator.
For flowing conditions the wireless gauge logs a reading from the quartz sensor prior to sending the data telegram. For shut-in conditions, the device remains dormant but monitors well pressure. Once it recognizes the restoration of flowing conditions with the associated pressure pulses, the device will log and transmit the highest pressure detected in the next telegram. Real-time well data is recorded and stored at high frequency within a web-driven data storage and management system from all well transducers field-wide, downhole and at surface. The data can be readily processed to assess well performance, monitor trends and detect anomalies.
Installation of the wireless gauge in A-35 demonstrated that the technology can be installed relatively easily into an existing production well and can successfully transmit data over a range of downhole operating conditions. Use of existing wellhead sensors to detect the pulse telegram resulted in a low-complexity system with minimal downhole hardware, and no associated topside modification to provide access to the data. Modeling proved to be representative of results obtained during service, and the tool was robust and reliable, delivering data in line with expectations.
There is room for improvement, however, in four main areas. One is installation efficiency. Although intervention operations to install and retrieve the wireless gauge were straightforward, additional runs were required to retrieve the device for re-programming and re-deployment. A lack of information during the planning phase can complicate programming ahead of installation. And although the test sweep provide valuable data in real well conditions, with simplex telemetry the tool must be recovered for reprogramming.
Since the A-35 run was completed, Tendeka has addressed this concern by programming a "pulse selection" feature into the tool that uses the shut-in detection feature to select a pulse from the pulse sweep. That pulse size is now selectable by implementing surface to downhole communication, with the well choked on the surface at a certain point following the test sweep. During this "time window," the system chooses which pulse test sweep to use for daily telegrams – as long as the test sweep contains a usable pressure drop there should be no need for pulling/reprogramming.
Another feature under review is data interpretation and hand-off. The data telegrams were readily detectable in the surface transducers with a 0.3-bar (4.3-psi) pulse, and no data were lost as a result of indistinct pulses or a misinterpretation of a well event. For future installations, Tendeka has developed interpretation software that can access the wellhead transducers, perform the interpretation and hand the results off to the operator's data storage rooms. A log of the interpretation is still recorded for quality control, with a user interface for diagnostic purposes.
The memory capacity in the A-35 wireless gauge was sufficient to record the transmitted data points and tool diagnostic data during pulse generation on a daily basis. Memory capacity in the tool has since been increased to allow full pressure build-up data to be recorded with sufficient capacity for several years.
Finally, the recovered gauge suffered no appreciable wear or degradation after over a year in service, but depletion of the primary power supply prevented the device from functioning for a longer period. The gauge's efficiency has since been improved to effectively double its service life, and further enhancements should be achievable with downhole power generation.
Acknowledgment
Based on a paper presented at a one-day SPE seminar staged in Berge, Norway, on April 2, 2014.


