The key to successful offshore structural monitoring
Prahlad Enuganti, Mike Campbell - 2H Offshore
No monitoring system is perfect. Even a well conceived and high specification monitoring system can provide unreliable results in the wrong hands.
A monitoring system is only as good as the data interpretation and processing techniques that succeed it. Structural monitoring offshore helps capture information valuable for both integrity management and R&D. Advanced data processing tools and sound engineering interpretation are necessary to maximize the value of the monitoring system.
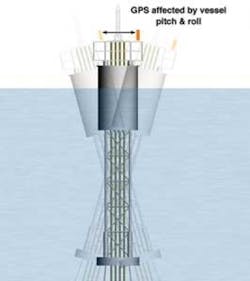
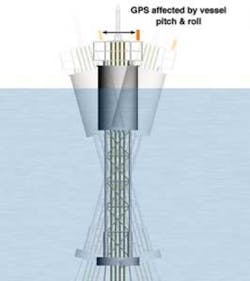
Adverse effect of vessel pitch & roll on GPS measurements.
Consider a GPS (global positioning system) on an offshore floating platform. Used to monitor vessel position and low frequency second order surge and sway motions, the monitoring system and its data interpretation appeared simple enough. However, evaluation of the GPS data revealed that the measured second order surge and sway motions were significantly larger than those predicted during design and, if taken at face value, cause real concern from a riser and mooring design perspective.
In reality, because the GPS was located well above mean sea level and its measurements were contaminated by the vessel’s low-frequency pitch and roll. Further analysis to remove the low frequency pitch and roll measurements from the GPS measurements shows no integrity concerns and that the GPS measured motions were within allowable limits. In this example, although the instrumentation system did meet its specifications, its value would have diminished without understanding the system and without the use of proper data analysis tools and techniques.
This GPS example was a successful offshore monitoring system. However, without an understanding of the accuracy and capability of the GPS without an understanding of the vessel motion characteristics and without the data processing tools to remove the contamination due to roll and pitch, this would not be the case.
Correct interpretation of data measured from an offshore structural monitoring system needs the following:
- Detailed understanding of instruments and specifications
- Sound engineering understanding of what is monitored and why, including potential failure mechanisms, natural frequencies, etc.
- Advanced data processing tools and techniques
- The right people.
Increasingly, operators use monitoring systems to measure vessel motions; mooring and riser tensions; and riser, flowline, and subsea jumper dynamic response.
Tracking fatigue life usage for integrity management.
As an example, over the past 10 years, BP, in support of an overall commitment to safety and reliability of operations, has undertaken an extensive assurance initiative to assess and maintain structural integrity for offshore drilling risers. Several drilling risers have been instrumented in a range of worldwide locations. The targeted benefits are to quantify actual measured fatigue damage to ensure that drilling risers are being operated in a safe, prudent manner, and to improve understanding of drilling riser behavior in high currents to find a more predictable and, hence safer, position on the engineering conservatism applied to operations.
One of BP’s key findings is that vortex induced vibration (VIV) does occur in the field. However, at least for drilling risers, it occurs to a much lesser degree than some software predicts. The field measurements also have helped determine the confidence in VIV prediction tools and associated fatigue factors of safety for design.
Example data visualization tool.
Other recent successful monitoring systems are the mooring line tension monitoring system on Shell’s BC-10 project and the Riser and Flowline Monitoring (RFM) system installed on Chevron’s Tahiti development. The mooring line tension monitoring system uses acoustic data transfer and communication. Tension monitoring allows problems such as mooring line degradation or failures to be identified early. The Tahiti RFM has state-of-the-art motion and strain measurement devices placed optimally along the SCR to continuously measure and store real-time, full-scale riser response. Data will be used to validate Tahiti riser and flowline system robustness and to conduct “health checks” on the fatigue critical risers and flowlines, particularly after significant environmental or operational events. All of the example systems above were supplied by 2H Offshore.
There are numerous examples where offshore monitoring systems have been used successfully to:
- Confirm that systems are being operated as planned in a safe and prudent manner
- Assist in operational decision making
- Manage integrity
- Identify and rectify problems that could have caused catastrophic failures
- Get feedback to improve design tools and methods.
Analysis on data from a monitoring system depends on the purpose of the system. Typical analysis is classified broadly into either integrity management or R&D.
A common pre-processing activity is noise removal. Data recorded by any sensor is contaminated by noise inherent to that sensor. In several applications, noise levels significantly impact the reliability of the sensor readings and need to be eliminated prior to data analysis. A popular noise removal technique is the digital filter. A frequency selective filter eliminates the sensor responses outside the frequency range of interest. In addition to filtering, there are other data processing techniques commonly used such as time and frequency domain integration, upsampling, spectral analysis, gravity correction, interpolation, spike removal, and curve fitting. To use data correctly, understanding of the instrument specification is essential in addition to the knowledge about any filters used, instrument location, and orientation.
For integrity management, instruments may be installed at locations on the subsea structure identified as fatigue critical or high risk during the design stage. At these locations, stresses are measured and rainflow stress cycle counted to track the fatigue damage accumulation over time. However, it is not always possible to install monitoring devices at the fatigue critical location. For such cases, finite element analysis determines transfer factors for converting measured stresses to those at the critical locations. Hence, damage rates at multiple critical locations can be tracked by installation of a single monitoring device. In addition, fatigue damage accumulation can be tracked over time to identify potential failures.
Data from a monitoring system also is used for software benchmarking and other R&D activities. Frequency analysis of data from sensors determines the driving force behind measured structural response. This enables the comparison of theoretical structural responses under different environmental against those measured in the field. Also, due to uncertainty in design basis data and actual structural response, design tools can have inherent safety factors included in the results. Measured field data also is used to calibrate design tools by comparing results from software predictions against field measurements to increase the degree of confidence in future designs. Such analysis also requires not only a good understanding of structural design but also an in-depth knowledge of the monitoring system and its limitations.
References
Tognarelli, M., Taggart, S., Campbell, C., “Actual VIV fatigue response of full scale drilling risers: with and without suppression devices”, OMAE 2008.
Tognarelli, M., Gabbai, R., Campbell, C., “An approach to include observed VIV likelihood in drilling riser fatigue analyses”, OMAE 2009.
Tn Petroleo, http://www.tnpetroleo.com.br/noticia/20364/fpso-espirito-santo-utiliza-sistema-de-monitoramento-de-linhas-da-2h.
Karayaka, M., Chen, J., Blankenship, C., Ruf, W., Podskarbi M., “Tahiti Online Monitoring System for Steel Catenary Risers and Flowlines”, OTC 2009.
