FPSOs continue to be the dominant deepwater solution
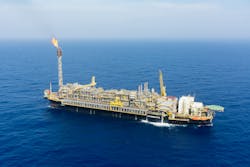
At a time of falling oil prices and global pandemic, the FPSO market is one of the few bright spots in the offshore oil and gas sector. Offshore’s 2020 Worldwide Survey of Floating Production, Storage and Offloading units poster, contained within this issue, shows a total fleet size of 213 FPSOs, with 164 installed, 23 on order, and 26 available. These FPSOs operate in more than 30 countries across the globe. Brazil is the most active region by far, accounting for about 30% of the market with 48 FPSOs in operation and eight more on order. A total of 31 FPSOs are in operation in Angola and Nigeria. No new units have been ordered for these locations since 2014, mainly due to governmental issues, including local content. After Brazil, the most active locations for new orders are Guyana, Norway, India, and Senegal, with two units each.
FPSO fleet profile
There has been a shift in the mix of the FPSO vessels in recent years. In 2016, the percentage of active vessels owned by a field operator was 48%. In 2020, this has increased to almost 53%. The main driver for this was the nine Petrobras FPSOs that began operation in 2017-2019 (P66-P70, P74-77). Petrobras ordered these units in 2010 and 2012, when oil prices were robust and government policies favored high local content. Going forward, the split is expected to remain close to 50/50.
The decision to own or lease an FPSO is based on a number of factors including expected field life, FPSO capex, field development financing plan, taxation, cost of capital, and operating philosophy. For the FPSOs on order, 12 of the 23 units are owned by leasing contractors, although it is likely that the field operator will purchase at least one of these units after delivery.
Under a Build Own Operate Transfer (BOOT) contract, the field operator purchases the FPSO after a period in service, typically two years. This puts the onus for start-up/warranty issues on the contractor that built the FPSO, while allowing the oil company to purchase the unit and take advantage of their lower cost of capital.
In 2016, 30% of the active FPSO fleet were newbuilds. In 2020, this number has now grown to 34%, driven by retirement of aging converted units and delivery of additional newbuilt FPSOs. This trend will continue as 15 of the 23 FPSOs on order (65%) are newbuilds. Almost half of the newbuilt FPSOs on order are being constructed by MODEC and SBM, which have developed their own FPSO hull designs. The industry has reduced the costs of these units through standardization and reduction of interfaces. These FPSO hulls are engineered for 35,000-ton topsides able to produce more than 200,000 b/d for new giant developments, such as offshore Brazil and Guyana. Cost savings and greater efficiency are expected through repeatability—designing one and building many. As a result, the construction project becomes more of a standardized or “factory” process rather than a customized conversion.
Cycle time
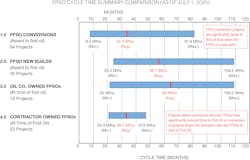
Analyzing the data from Offshore’s 2020 Worldwide Survey of FPSOs shows some clear differences in the cycle time based on the type of hull (conversion or newbuild) as well as ownership (oil company or lease contractor). It is important to note that these are not like for like comparisons, as FPSOs vary widely in cost, capacity, and complexity. However, the data shows some interesting trends. The shortest cycle at eight months, was to redeploy the MTC Ledang, an existing leased FPSO designed to process 15,000 b/d in shallow water. The longest cycle time at 109 months was the last of the serial newbuilt FPSOs by Petrobras (P-70), which can process 150,000 b/d of oil and 212 MMscf/d of gas in ultra-deepwater.
Conversion or newbuild
On average, the cycle time for a newbuilt unit required almost two years more than a converted unit, with converting an FPSO lasting 34.5 months from contract award to first oil, compared with 56.7 months for newbuilt units. However, there is a large range with some conversions taking up to 81.9 months and some newbuilt FPSOs only requiring 25.4 months.
Explanations for the longer time required for a newbuilt FPSO could include more detailed hull engineering, longer design life, turret mooring, and harsher environment (most units for the North Sea are newbuilt).
The data is somewhat skewed due to Petrobras’ series of FPSO units with large local content requirements: P66-P70 (newbuilds) and P74-P77 (conversions). These units experienced extensive delays, resulting in the units being largely completed in China. As a result, they have the longest cycle times: 71-81.9 months for the converted FPSOs and 78.1-109.2 for the newbuilds. By comparison, leased units with similar specifications awarded to MODEC and SBM had cycle times of 31-43 months.
FPSO redeployment
Re-using an available FPSO resulted in the shortest average cycle time – only 19.8 months. Since the unit has already been operating as an FPSO, the main works are typically life-extension and modifications to suit the new field requirements. While most redeployments have cycle times under two years, there are examples where the cycle time for an existing FPSO unit extended to almost 42 months. In this case, the FPSO was relocated to a new region and extensive topside modifications were required to process a different type of crude oil.
The ownership issue
There is a stark difference in cycle times of FPSOs based on ownership at the time of first oil. When looking at FPSOs awarded since 2010 that have achieved first oil by 2020, the average contractor-owned FPSO had a 48% shorter cycle time than units owned by field operators. On average lease contractors required 33.9 months from award to first oil compared to 65 months for field operators. That does not mean that leased units always have shorter times. The cycle time for leased units ranges from 21-47.9 months compared to 22-109.2 months for field operators.
Lease contractors and field operators have both encountered schedule delays in FPSO projects. However, the longest cycle times all belong to units owned by field operators. In addition to the Petrobras units discussed above (P66-70, P74-77), it took more than 60 months from award to first oil for Western Isles, Egina, Glen Lyon, and Ichthys Venturer.
By contrast, the longest cycle time for a contractor-owned FPSO was less than 48 months. As lease contractors execute FPSO projects more frequently than field operators, they may have greater ability to provide additional resources and work with their established suppliers to mitigate delays more quickly. In addition, it is possible that the specifications for field operator-owned FPSOs are more bespoke and/or onerous, resulting in underestimation of the complexities to meet these requirements. These company-specific requirements had expanded significantly during the boom times. During the last downturn, there was a large effort to use industry or contractor standards, resulting in shorter delivery and lower costs.
COVID-19
The industry has made great strides to reduce FPSO cycle time through standardization of specifications and hull designs. The full impact of COVID-19 on FPSO cycle times remains to be seen. Most units on order are expected to experience delays of six-12 months, depending on its stage of construction, yard location, and payment terms. Many field operators have cut capex for 2020, requiring re-phasing of most sanctioned projects.


