Editor's note: This article first appeared in the May-June issue of Offshore magazine. Click here to view the full issue.
By Mark J. Kaiser, Louisiana State University
Public oil and gas companies are required to report the present value of their decommissioning liability, referred to as asset retirement obligations (AROs) and provisions, for all oil and gas assets worldwide where there is a legal obligation to perform.
One well-known feature of the oil and gas industry is the strong correlation that exists between production and reserves. In the first part of this two-part series, we show that a similar relationship arises between AROs and production, a much less obvious result but one with important implications.
We begin with the regulatory definitions of AROs and provisions and how AROs are estimated at the corporate level.
Asset retirement obligations
Whenever a well is drilled, equipment installed, or a pipeline placed in service for oil and gas production, there is a legal obligation in the US for the operator to abandon the well when no longer producing or useful for service, remove the equipment, decommission or remove the pipeline, and restore the site to its original condition. These are called asset retirement obligations and public oil and gas companies are required to disclose the present value of their AROs annually in their financial reporting.
Outside the US, legal requirements for decommissioning vary widely depending on the country’s regulatory regime and the contract terms that govern exploration and production. International accounting standards for public companies reporting decommissioning liability are included within a broader category called provisions with (slightly) different rules and requirements than AROs, but generally speaking the two liability classifications are quite similar.
Reporting requirements
For public companies that are organized under the laws of the United States or are listed on US exchanges, US Generally Accepted Accounting Principles (GAAP) are required, also referred to as the Financial Accounting Reporting Standards (FASB). In other countries, International Financial Reporting Standards (IFRS) as issued by the International Accounting Standards Board (IASB) are employed.
Both standards require decommissioning liabilities to be recorded at the present value of the expenditures expected to be required to settle the obligation. The amount should reflect the best estimate that a company would pay to settle the obligation at the balance sheet date or to transfer it to a third party at that time. These standards are similar but not identical, with differences in terminology, reporting requirements and measurement.
Asset retirement obligations associated with the retirement and decommissioning of tangible long-lived assets are required to be recognized under FASB guidelines as a liability in the period in which a legal obligation is incurred and becomes determinable, with an offsetting increase in the carrying amount of the associated asset. The cost of the tangible asset, including the initial recognized ARO, is depleted such that the cost of the ARO is recognized over the useful life of the asset. The fair value of the ARO is measured using expected cash outflows associated with the ARO, discounted at a credit-adjusted risk-free rate when the liability is initially recorded. Accretion expense is recognized over time as the discounted liability is accreted to its expected settlement value.
Where an obligation exists for a new facility or item of plant, such as oil and natural gas production or transportation facilities, this liability is recognized on construction or installation. Similarly, where an obligation exists for a well, the liability is recognized when it is drilled. An obligation for decommissioning may also crystalize during the period of operation of a well, facility or item of plant through a change in legislation or through a decision to terminate operations (e.g., additional or lesser work may be required when wells or infrastructure are preserved or decommissioned to a different standard); an obligation may also arise in cases where an asset has been sold but the subsequent owner is no longer able to fulfill its decommissioning obligations, for example due to bankruptcy. Let’s look at how AROs are estimated.
Decommissioning cost
Decommissioning costs are estimated at a field (or project) basis by engineers and project managers using historical data, internal estimates and market information. Typically, plug and abandonment well cost and structure removal cost are based on estimated duration and estimated rig spread rates, lift boat rates (if offshore), and planned abandonment logistics. Rig rates may be based on a rolling three (or five) year average observed in the marketplace for similar types of rigs. Estimated duration is normally based on historic jobs adjusted for site-specific conditions.
Timing
The cessation of production is estimated by decline curve methods and assumptions on commodity prices, operating cost and economic limits, similar to the standardized measure of proved reserves (STM) calculations. Companies that follow FASB guidelines apply proved reserves P1 in their timing assessment, while companies following IASB guidelines may apply 2P reserves (proved plus probable), which will normally add several years to the time when production is no longer profitable and reduce the discounted cost of future decommissioning (compared to P1 reserves calculations).
Discount and inflation rates
Assumptions on discount rate and inflation rate in ARO calculations are company specific, whereas in the standardized measure of proved reserves calculations, discount rates are fixed at 10%. The discount rates applied in ARO calculations consider the risk-free rate by term and currency, country risk and a spread according to the debt structure and cash flow project period. Companies that apply low discount and inflation rates (1-3%/yr) are essentially valuing future decommissioning cost under current undiscounted conditions, and this appears to be a common assumption among companies, while high discount and inflation rates (4-8%/yr) assume significantly lower present value to these costs. Companies do not have to report the discount/inflation rates applied, but rates are sometimes disclosed.
Commodity prices
Commodity price assumptions impact ARO cost directly and indirectly through their impact on market cost assumptions and timing effects. In STM computations, commodity prices are assumed the average of the last reporting period, but in ARO estimation there are no specific requirements on what commodity prices should be applied. One would think similar price assumptions would be applied in both ARO and STM calculations, but this is not required.
Categorization
Public companies and government-sponsored enterprises (GSEs) are organized into integrated and independent company groups, and two subcategories for independents are applied, primarily offshore and primarily onshore independents. Primarily onshore/offshore companies have more than half of their production onshore/offshore.
Most national oil companies (NOCs) do not report ARO, STM or well data, but we include a few NOCs in our sample (e.g., Saudi Aramco, and the four major Russian majors Gazprom, Lukoil, Novatek, and Rosneft) even though they are of a different character than public companies and GSEs, especially in terms of geopolitical drivers and the manner of decision making.
Saudi Aramco and the four major Russian companies are all integrated oil and gas companies, but having only a small percentage of their production offshore (or in the case of Saudi Aramco, low-cost shallow water production), these companies are more like independent onshore producers in terms of their ARO requirements since AROs do not include downstream or midstream assets. Russian companies produce offshore in the Arctic, Far East and their Southern Seas (Azov, Black, Caspian), but as a percentage of total production, offshore regions contributes 5% or less per company (10% for Lukoil), and thus, these companies can be categorized as primarily onshore producers.
Two integrated producer groups are identified: “Integrated” and “Integrated-” where the minus sign signifies the exclusion of Saudi Aramco and the four major Russian companies from the sample. Independent onshore companies are denoted “Onshore”, and the “Onshore+” group signifies the addition of Saudi Aramco, Gazprom, Lukoil, Novatek, and Rosneft to the sample.
Integrated sample group
The integrated sample group includes 19 integrated companies along with several NOCs. Equinor and Petrobras are almost exclusively offshore operators (>90% production derives from offshore fields), whereas about two-thirds of Pemex and ONGC production comes from offshore operations. All other companies, except Saudi Aramco and the four Russian companies, have offshore production contributing between 20-60% total production.
Primarily offshore producers
Twenty-three companies with at least half of their production from offshore were identified as primarily offshore producers, and twenty-one companies comprised the primarily onshore producer group.
The independents sampled contain a few large producers (>400 MMboe) such as ConocoPhillips, CNOOC, one of China’s GSEs, and Occidental, many moderate-sized companies (50-400 MMboe) like Apache, EOG, Hess, Murphy, Santos, Wintershall, and Woodside, and many small companies (5-50 MMboe) such as Callon, DNO, Kosmos Energy, Spirit Energy, and Tullow Oil. A few very small companies (<5 MMboe) were used in the primarily offshore group such as Cooper Energy, Horizon Oil, Pharos Energy, and Transglobe Energy.
Primarily offshore producers include several international companies: CNOOC (China), Galp (Portugal), INPEX (Japan), Kosmos Energy (UK), Lundin (Sweden), OMV (Austria), Neptune Energy (UK), Pharos Energy (UK), Tullow Oil (UK), PTTEP (Thailand’s NOC), Santos (Australia), Transglobe (Canada), Wintershall (Germany), and Woodside (Australia), and since most of these companies follow IASB accounting standards, well counts and STM measures are usually not reported. There are only three US companies in the offshore group: Murphy, Talos Energy, and W&T Offshore.
Primarily onshore producers
Primarily onshore producers include mostly US companies with US production. Almost all the primarily onshore producers are US companies that operate exclusively onshore in the US, and because these companies follow FASB guidelines, well counts and STM measures are mandatory. DNO (Norway) and MOL Group (Hungary) are the only non-US company in the onshore sample.
Many independents do not directly delineate onshore and offshore production, and segment production had to be inferred for several companies. Most offshore companies sampled operate almost exclusively (>90% production) offshore, and only OMV, Murphy and Woodside have a more balanced onshore/offshore mix. Most onshore companies sampled produce exclusively onshore, but five companies also had offshore production (ConocoPhillips, DNO, Hess, Marathon Oil, Occidental) ranging between 15-40% total production.
Production vs. reserves
Reserves are the storehouse of production, and since production operations are subject to the same engineering requirements in field development, similar business constraints (at least for public and private companies, and to a large extent GSEs) and market conditions, it is not surprising that production and reserves correlate across similar industry groups.
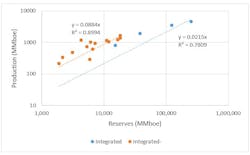
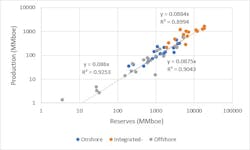
Year-in year-out, the basic oil and gas business models in capital markets hold fast and true, and this is observed for the production-reserves relationships shown in Figure 1 for integrated companies, and in Figure 2 for offshore independents and onshore producers. With production and reserves varying more than three orders-of-magnitude, log-log plots are used.
For integrated companies, 0.022 barrels of oil equivalent were produced in 2021 for every boe reserves in the ground. If Saudi Aramco and the four Russian companies are excluded from the integrated group (Integrated-), the integrated companies produced on average about four times more per barrel reserves (0.088 boe/boe).
Public companies produce more of their reserves compared to NOCs because of their development strategy and capital requirements, and because NOCs are agents of the state subject to their government’s geopolitical aims which fall outside profitability criteria. Political factors play a large role in NOC decision making hidden behind the veneer of corporate strategy.
For primarily onshore and offshore producers, a very similar relationship to the Integrated- group results, with the model coefficient being 0.088 and 0.086 boe/boe (Figure 2). For all three groups, the production-reserves relations are essentially identical.
STM vs. production
Production generates revenue and is valued using cash flow analysis over the lifetime of assets and reported as the standardized measure of reserves. STM values, along with production and oil prices, are the three most important factors determining a company’s market capitalization and enterprise value.
STM is computed according to a common set of assumptions across the FASB universe, and therefore, like proved reserves, the valuation of reserves and production are expected to be strongly correlated.
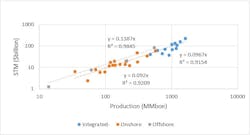
STM and production are linearly related for all company groups (Figure 3), with offshore producers realizing the highest boe value at $139/boe, followed by integrated companies at $96.7/boe, and $92.0/boe for onshore independents.
The slopes of the lines depend on oil price, and will increase/decrease year-by-year increasing with higher (average) oil prices during the reporting period and decreasing with lower (average) oil prices.
Only five offshore producers report STM data so caution is warranted in interpreting the $139/boe statistic. Offshore companies may or may not fall within the range described by onshore and integrated companies, $92/boe and $96.7/boe.
The fact that the line segments are roughly parallel is also no accident, but indicative of industry similarity, at least in the way STM values are computed, determined via cash flow models using a similar set of assumptions according to regulatory guidelines.
ARO vs. production
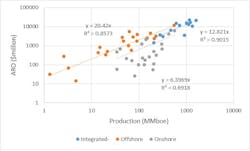
ARO and production are linearly related for each company group and the results follow expectation (Figure 4). All the company groups are well populated (14 integrated-, 23 offshore, 21 onshore) and the results are considered reliable and significant.
Offshore producer AROs are greater per boe than a mixed onshore/offshore production mix characteristic of integrated companies which are more expensive than onshore AROs: $20.4/boe (offshore), $12.8/boe (integrated-), and $6.4/boe (onshore).
One might not suspect that such strong fits would result, nearly as strong as the STM-production models (and “reasonable”), but because AROs/provisions are estimated under broadly similar guidelines to STM, perhaps the relations are not that surprising since AROs are also model constructs like STM.
ARO and production behave in a broadly similar manner as reserves and STM with production, and since this is neither intuitively obvious nor self-evident, an empirical demonstration is both convincing and satisfying.
The slopes of the lines in Figure 4 provide valuable quantitative information on the relative difference in ARO cost per boe production by geographic specialization. Independent offshore producers realize the highest ARO unit cost, $20.4/boe, and independent onshore producers the lowest ARO unit cost, $6.4/boe. Integrated companies, excluding Saudi Aramco and the four Russian majors, fall in-between these limits at $12.8/boe.
The author
Mark J. Kaiser is Professor at the Center for Energy Studies, Louisiana State University, Baton Rouge, Louisiana.

