New statistical model can help operators estimate shallow-water platform removal costs
Editor's note: This story first appeared in the January-February 2023 issue of Offshore magazine. Click here to view the full issue.
By Mark J. Kaiser, Louisiana State University
The Bureau of Safety and Environmental Enforcement (BSEE) has collected decommissioning expenditure data from operators in the Gulf of Mexico since 2016 to estimate the decommissioning liability of federal leases.
BSEE uses this data to compute expected decommissioning cost for active wellbores, structures, and pipeline segments but does not otherwise disclose the statistical results of their data-collection efforts or methods employed in cost estimation.
In the third part of this series, we describe the main cost factors for structure decommissioning, summarize BSEE cost statistics, and construct cost functions from the data.
Cost factors
The removal of the topside facilities, deck, conductors, piles, and jacket is the core of most decommissioning projects, but not necessarily the most expensive part, since the relative contribution of structure removal cost depends on the size/weight of the structure and the number and type of wells present at the time of decommissioning.
Operators that wait till cessation of production to plug and abandon their well inventory will have a greater PA cost than operators who move wells to PA earlier. In many cases, operators choose to keep most of their wells open simply because they do not know if a well will prove useful in the future, but in other cases, operators with no further need for wells may want to simply delay spending.
Production equipment and deck modules need to be placed on a cargo barge and returned to shore for scrap or reuse; conductors, casing string, and piling need to be cut, pulled, and removed from the ocean floor at least 5 m (15 ft) below the mudline; and the jacket needs to be lifted and taken onshore, to another location, or to an artificial reef site.
If the structure resides within a reef planning area, topple-in-place or partial removal may be a viable option. Caissons are rarely reefed because they lack the structural complexity for viable marine ecosystems, but fixed platforms in shallow water have been reefed in large numbers.
Structure components that need to be removed are often large and heavy. Deck weight varies with the configuration type, the number and size of casing strings, and water depth, and for fixed structures can weight from 20 tons to more than 150 tons. Jackets in 30 m (100 ft) of water can weigh as much as 600 tons and in 91 m (300 ft) more than 3000 tons. Soil shear resistance and grouting can add 10-15% to removal forces.
The size and weight of the deck and jacket are important because they determine the size and type of construction equipment required for the operation. A company selects the derrick barge based on the water depth in which the barge can safely operate, the lift capacity of the cranes, and market availability. The minimum derrick barge required is determined by the maximum load weights expected during the operation. In shallow water, the deck is normally the heaviest lift, while in deepwater, the jacket weight normally exceeds the deck weight.
The jacket is anchored to the sea floor by piles driven deep into the seabed. Explosives are prepared and installed in the piles and skirt piles. If the mud plug inside the piles is not deep enough to allow the explosive charge to be placed at the required depth, the mud plug is jet/air lifted. As an alternative to explosives, abrasive cutters can also be used. The jacket is removed as single lift or in sections after the bottom cuts have been completed.
Market rates for derrick-barge spread depends on depth rating and crane vessel capacity. Day rates are useful indicators of supply and demand trends, but because most decommissioning projects are bid on a lump-sum basis, they are not as meaningful as the bid price or actual cost incurred in the operation.
Cost statistics
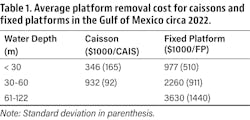
The average cost to remove a caisson in <30 m water depth is about three times less than a fixed platform, $346,000 vs. $977,000 (Table 1). As water depth increases, steel structures are larger and heavier and require a greater capacity lift boat to remove the topsides and jacket, which increase dayrates, work duration, and decommissioning cost.
In water depths from 30-60 m, caisson removals are estimated to cost on average $932,000 vs. $2,260,000 for fixed platform removals. In water depth from 61-122 m, platform removals are estimated to cost on average $3,630,000.
Standard deviations of the estimated cost in most categories are about half the average statistic, large but not excessively so. Standard deviations cannot be interpreted in any useful way, however, since they are an artefact of the modeling effort, and not based on the original cost data.
One might (wrongly) conclude that small standard deviations indicate reliable and accurate cost estimates, but this is an incorrect interpretation since the values are model based, and describe the model correlates employed.
Cost functions
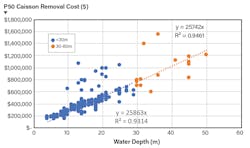
A plot of caisson removal cost vs. water depth shows a strong linear relationship, with nearly identical trendlines, for both water depth categories (Figure 1):
Caisson Removal Cost (<30 m) = 25,863 WD, R2 = 0.93.
Caisson Removal Cost (30-60 m) = 25,742 WD, R2 = 0.95.
Most of the dozen or so data points in Figure 1 that fall above the trendline represent either more complicated caissons (e.g., braced caissons, caissons with skirt piles, etc.) or are fixed platforms misclassified as caissons. Most of these data points are assigned SC&V (site clearance and verification) cost of $141,000, a primary indicator of fixed platform cleanup cost, and so the evidence for misclassification is strong. Structure-type flags are not always consistent in the database, and although such discrepancies arise, they are not frequent, and do not significantly impact the model fits.
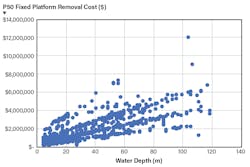
Removal cost for fixed platforms also increase with water depth, and apparently, linear models were employed using water depth and one or two additional attributes, since linear subtrends are readily apparent (Figure 2). These data “corridors/fingers” extend upward and to the right and are direct indicators of model application.
Using well slots and/or bed count as a proxy for structure complexity/size, linear trends are applied. Well slots and/or bed count are a proxy for structure size and complexity, with more slots/beds associated with larger structures which should correspond to greater removal cost.
The use of either proxy is not ideal since they are indirect measures, but one or both of these attributes appear to do a reasonable job in describing the cost data. More specific structure characteristics are neither collected nor available for analysis so we are severely constrained in model construction. All the model coefficients are positive and (highly) statistically significant, which indicates that BSEE are probably employing a similar algorithm and attribute (or a correlated variable) in evaluation:
FP Removal Cost (<30 m) = 32,304 WD + 69,466 SLOTS, R2 = 0.73.
FP Removal Cost (30-60 m) = 32,973 WD + 83,720 SLOTS, R2 = 0.88.
FP Removal Cost (61-122 m) = 30,757 WD + 72,937 SLOTS, R2 = 0.91.
In the <30 m water depth category, a few dozen elements identified as fixed platforms are probably caissons, since in this case they have SC&V values characteristic of one well structures (i.e., SC&V = $54,000).
We made no attempt to recategorize structures, but if we did the model fit in <30 m would improve significantly, removing much of the variability that cannot be explained by the model. In deeper water, there are fewer (or no) platform misclassifications, since caissons are simply not prevalent, and the model fits improve.
In the 30-60 m water depth category, the model fit is R2 = 0.88, and in 61-122 m water depth, R2 = 0.91. The <30 m water depth cost function would have a comparable model fit to these functions if misclassifications were identified and adjusted.
Not all fixed platforms are populated with well slot and bed count data, so sample sizes are smaller than active lease count and decrease whenever an additional attribute is considered. In the 61-122 m water depth category, one exceptional point was excluded, complex 27008 on EC328 in 79 m water depth with estimated removal cost $44 million.
The $12 million and $9 million complexes shown in Figure 2 are 20375 in SP 62 (104 m) and 686 (Hickory) in GS 116 (107 m).
About the author: Mark J. Kaiser is a professor at the Center for Energy Studies, Louisiana State University, in Baton Rouge, La.

