Integration of all research tools provides critical checks and balances
Davis W. Ratcliff, David J. Weber
Diamond Geophysical Corp.
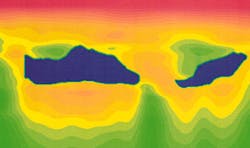
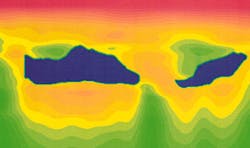
A cross-section through the 3D velocity model after seven iterationsAbout four years ago, the prevailing perception regarding offshore exploration in the Gulf of Mexico was that the shelf was all but played out and in steady decline. And, because of limited technology and experience, the deepwater was deemed far too risky for most and therefore reserved for only a handful of deep-pocketed majors. In fact, most companies were in an exit strategy from the Gulf of Mexico.
Then, in October 1993, the Mahogany subsalt discovery changed this direction, seemingly overnight, and ignited the hopes of many who yearned for new discoveries and better times ahead.
The development of geophysical technology and its accomplishments in the Gulf of Mexico's subsalt trend over the last three years has been phenomenal. Results from the world's largest 3D prestack depth migration (3D-PreSDM) project provide a unique opportunity to look at four separate subsalt wells, each with its own set of imaging problems. Two of these wells were successful and are scheduled for development, and the other two were not so successful - at least not initially.
The past three years have witnessed an explosion of new ideas and newly developed technology regarding the imaging of the subsalt trend. We can now look back and see that these technologies are greatly assisting our ability to predict subsalt geology and will one day become commonplace. Large volume 3D depth imaging is vital to any subsalt exploration or development strategy. It can enhance subsalt imaging (faulting, stratigraphy, etc.), reduce exploration risks, and optimize subsalt well placement. These technologies are not only economically feasible, but imperative in securing a satisfactory rate of return on investment.
Research into subsalt amplitude analysis, 3D AVO, stratigraphy, 3-D pore pressure prediction and 3D modeling of poorly illuminated zones is gaining momentum, and will assist the geoscientist to explore and produce subsalt hydrocarbons in a more cost-effective manner. Other developing reservoir characterization tools, such as water saturation and net sand prediction, will also be part of the tool chest. Integration of geophysical technology is critical to the understanding of subsalt geology. The newly developed technologies have worldwide application in areas where large velocity variations are inherent.
The subsalt play has truly challenged our industry. But geoscientists and oil finders have risen to the occasion. New challenges associated with subsalt remain and we are likely to see continued successes and failures along the flex trend and into the deeper water environment where salt structures are even more prolific.
However, it is certain that geophysical technology, both structural imaging and lithology prediction, will play a vital role in our quest to find and extract the subsalt treasures that motivate us to explore.
Four-well case study
- The now famous Mahogany No. 1 well, operated by Phillips Petroleum with partners Anadarko and Amoco, in offshore Louisiana's Ship Shoal South (SSS) Block 349, drilled through approximately 4000 ft. of salt into several pay zones. The most important is the "p-sand" - about 100 ft of thinly laminated oil pay.
- The Agate subsalt discovery by Phillips and partner Anadarko, drilled in 1996, is a separate discovery southwest of Mahogany, in SSS Block 361. This discovery was actually associated with an amplitude outboard of salt, but the pay sand may also extend up underneath the exposed salt sill.
- The unsuccessful Rhino prospect drilled by Unocal and partner Conoco in SSS Block 360 has both its base of salt and subsalt reflectivity disturbed on both sides immediately adjacent to the well, as spotted on the 3-D PreSDM data. One possible interpretation indicates that the well drilled into a salt-weld zone or high angle fault. If this is correct, then exploration potential may exist to the north (right) of the well as indicated by a strong subsalt event. This block was subsequently released and picked up by Pennzoil in the 1996 MMS Central Gulf lease sale.
- The fourth well is the Alexandrite prospect located in SSS Block 337. Anadarko-Phillips-Amoco paid $40 million for this block only to plug and abandon after their first attempt. It too has a disturbed base of salt at the well location, as well as several subsalt faults near the well. The well did not penetrate any obvious amplitude-related reflections. Although some anomalies exist to the south of the Alexandrite No. 1 drill location. Only additional drilling will determine whether this prospect was adequately tested.
Project process
The project area for this case study is located in the Ship Shoal South/South Timbalier South areas of the Gulf of Mexico and covers about 75 OCS Blocks, with 36 OCS Blocks of 3D PreSDM output, or about 315 square miles. Approximately 180 million seismic traces were preprocessed and input into the 3D PreSDM. The output was approximately 600,000 stacked traces.
Preprocessing included careful editing of the shot data to remove noise bursts prior to migration. First break muting and gain recovery were applied to condition the seismic data for deconvolution. A two-windowed, time variant spiking deconvolution with a 320 ms operator length was used to dereverberate and whiten the data prior to depth migration.
To further suppress reverberations associated with the top and bottom of salt, we applied a second deconvolution step which had a predictive length of 32 ms and an operator length of 420 ms. Once the data were deconvolved, a time variant bandpass filter was used to remove high frequency noise. The data were then resampled to 8 ms and the gain recovery was removed in order to satisfy the input assumptions of the Kirchhoff migration algorithm.
After preprocessing, the data were input into the 3D prestack Kirchhoff depth migration step. We used seven iterations of full volume 3D PreSDM velocity analysis to develop the final velocity model. The salt and sediment model underwent a substantial amount of refinement and became more geologically correct with each iteration. It should be noted that the most critical and time consuming aspect of the 3D PreSDM imaging project was building the velocity model.
After the final velocity field was derived, the data were 3D prestack depth migrated and output onto a grid that was 37.5 m inline by 40 m crossline and down to a depth of 7.5 km. The Kirchhoff migration parameters included a depth variant migration aperture with maximum dips of 75! and minimum dips of 35!, with the antialias option turned on to reduce artifacts associated with the migration operator.
Seismic vs. well logs
Initial observation indicates a good top of salt and base of salt tie, in terms of seismic character. In terms of depth, the seismic image is about 1% (100 ft) off with the synthetic on the top of salt and about 3% (300 ft) off on the base of salt. One reason for this small discrepancy is the transverse isotropy effect, which was not corrected for in the processing.
Since a single homogeneous salt velocity of 14,700 ft/s was used, the small and isolated velocity anomalies were not accounted for in the 3D velocity building stage (further accounting for the 3% mistie at the base of salt). The main subsalt pay horizon (p-sand) also ties very nicely with the trough-peak sequence on the well synthetic. Although not resolved, an additional 30-ft pay zone is also highlighted on the subsalt section.
3D acquisition design
Successful 3D subsalt imaging begins with a well designed acquisition strategy. It should include long offsets (6000 m minimum), long record lengths (10s minimum), tight line spacing (40 m minimum), and very tight navigation positioning accuracy, especially on the far offsets. This improved far offset positioning plays a critical role in the 3D PreSDM process, and is largely responsible for the excellent imaging results below salt.
After careful 3D acquisition and full volume 3D PreSDM, the data are output on a 37.3 m x 40 m spacing. The 3D PreSDM techniques assist the geophysicist by offering a better assessment of subsalt exploration risk and help to identify and refine new subsalt prospects. Geological benefits include the ability to better understand salt deformation and its effects on overlying and underlying sediments.
The ability to focus base of salt and subsalt reflectivity has enabled geologists to better discern trap timing below salt, subsalt migration path ways, subsalt stratigraphy, and reservoir seal integrity below these massive salt structures.
Last, but certainly not least, is that 3D PreSDM also benefits the drilling engineer in optimizing well locations and platform placement. The 3D velocity field generated through the seven iterations of 3D PreSDM velocity analysis can be transformed to 3D pore pressure volumes. These pressure pictures can help identify pressure anomalies above and below salt in three dimensions. Knowledge of the existence/locations of these pressure cells can influence casing design strategies as well as drill bit placement.
Research tools
Some research ideas that will assist in exploration and development of subsalt hydrocarbons include investigations into 3D subsalt AVO, 3D ray trace modeling, 3D subsalt pore pressure prediction, and coherence technology. We will see that our understanding of subsalt geology becomes much clearer after integrating these various geophysical tools and research ideas. Amplitude variation with offset (AVO) or incident angle (AVA) has proved effective in above salt exploration and development. However:
Y Can 3D AVO below salt via 3-D PreSDM assist in better understanding subsalt geology?
Y How do amplitude distortions caused by a thick salt mass manifest themselves in the subsalt section?
Y Should we even bother with 3D AVO below salt, considering the travel path distortions?
We see that near-range depth migration has preserved base of salt better than the full-offset stack. There are at least two reasons why we see this degradation in the base of salt on the far offset stack. First, a strong decrease in amplitude versus offset is associated with the base of salt/subsalt section as seen from the AVO depth synthetic.
Also, depending on the salt shape, salt thickness and dip angle of top of salt, we find a lack of base of salt reflections with increasing offset due to ray paths going to critical angle as they enter into top of salt. The exact angle or offset at which this occurs will depend on the velocities above salt and the salt morphology itself. However, we can generally conclude that it is geologically acceptable to pick/interpret top and base of salt using the near offset volumes.
Now, let's compare the near and full offset stack results in the subsalt section. The near-offset migration shows some evidence of the p-sand at the well bore location, but the full offset stack shows a clear and better defined p-sand on both the upthrown and downthrown sides of the subsalt fault. Are these increases in amplitude with offset related to rock properties, raypath distortion, or something else? More research is required to fully understand these observations. All we know today is that each segment of the 6000-m cable has a different story to tell in terms of subsalt stratigraphy, subsalt rock properties, raypath distortion, subsalt multiples, and converted waves below salt.
As with any AVO analysis, it is much more informative to use a map rather than a vertical cross sectional view. Because of these features. we feel that multi-offset 3D prestack depth migrated volumes are vital to the understanding of subsalt geology.
Raypath distortions
In order to better understand the 3D AVO volumes, we must have a working knowledge of the 3D raypath distortions associated with the salt and subsalt section, because they are both related. In addition, we need to be familiar with the acquisition sampling of the subsalt section (i.jpg align=left., hits per bin), and the distribution of incident angles below and outboard of salt so that our 3D AVO observations can be understood, quality controlled, and utilized for extraction of subsalt rock property information.
Cross-sections from the velocity model and the 3D ray tracing results can now be used to evaluate the distribution of incident angles. The raypaths reveal information about incident angles. This information can be extremely useful in subsalt AVO analysis, especially when we extend it to three dimensions, and 3D incident angle maps are created. Again, it is critical to integrate the 3D AVO results with raytrace modeling so that we can maximize the amount of geologic knowledge extracted.
Pore pressure prediction
Another tool developed to better understand the subsalt section is 3D pore pressure prediction. Using the 3D PreSDM velocity model and well-control, we can generate cross-sectional profiles of pore pressure. Typically referred to as the gumbo zone, overpressured shale masses are usually the result of not being able to dewater in time before the salt is extruded overhead. Drilling engineers could certainly use this information.
As with 3D AVO, it is better to view pressure in three dimensions. Integration of pore pressure volumes with 3D subsalt AVO can further enhance our understanding of the subsalt geology in terms of subsalt amplitudes and reservoir seals. The 3D pressure technology is a new and emerging tool that will become increasingly useful because it can detect high and low pressure cells in a spatial sense, and it can also increase confidence in seal integrity over prospects on a regional basis.
Subsalt coherence
Coherence cubes, generated from 3D prestack depth migration results, can accentuate stratigraphy, faulting and shale masses both above and below salt. Coherence techniques applied to depth migrated 3D data will further assist in subsalt prospect evaluation.
These techniques can be used worldwide in areas that have non-salt-related structures with large lateral and vertical velocity variations. Subsalt geology, although prevalent in the Gulf of Mexico, is also found in many other areas including the North Sea, West Coast Africa, Gulf of Suez, and even parts of the Pacific Rim.
The application of 3D depth imaging technology is, of course, governed by cost and reservoir economics. Generally speaking, though, in areas of complex geology and high well costs, 3D depth imaging should be considered as a standard geophysical tool.
Technology integration
Effective integration of these tools will perhaps play the most important role in our understanding of any subsalt prospect. Although similarities exist, each area will have its own unique geologic characteristics. Integration of the various 3D technologies will provide the check and balance mechanism needed to better understand each specific area.
Imagine if you will, integration on a horizon basis below salt, 3D AVO technology with 3D raypath bin maps with 3D pore pressure horizon maps with 3D coherence maps. This could only assist in bridging gaps in our knowledge of subsalt geology, and reduce exploration risk.
The past three years have witnessed an explosion of new ideas and newly developed technology regarding the imaging of the subsalt trend. We can now look back and see that these technologies are greatly assisting our ability to predict subsalt geology and will one day become commonplace.
Large volume 3D depth imaging is vital to any subsalt exploration or development strategy. It can enhance subsalt imaging (faulting, stratigraphy, etc.), reduce exploration risks, and optimize subsalt well placement. These technologies are not only economically feasible, but imperative in securing a satisfactory rate of return on investment.
Research into subsalt amplitude analysis, 3D AVO, stratigraphy, 3-D pore pressure prediction and 3D modeling of poorly illuminated zones is gaining momentum, and will assist the geoscientist to explore and produce subsalt hydrocarbons in a more cost-effective manner.
Other developing reservoir characterization tools, such as water saturation and net sand prediction, will also be part of the toolchest. Integration of geophysical technology is critical to the understanding of subsalt geology. The newly developed technologies have worldwide application in areas where large velocity variations are inherent.
The subsalt play has truly challenged our industry. But geoscientists and oil finders have risen to the occasion. New challenges associated with subsalt remain and we are likely to see continued successes and failures along the flex trend and into the deeper water environment where salt structures are even more prolific. However, it is certain that geophysical technology, both structural imaging and lithology prediction, will play a vital role in our quest to find and extract the subsalt treasures that motivate us to explore.
[Editor's Note: This is a greatly abridged version of a paper written by Davis Ratcliff and David Weber and presented by Davis Ratcliff at the Subsalt Technology Conference in Houston January 30, 1997. For a full text complete with some 60 figures, see the February edition of The Leading Edge.]
