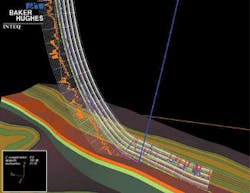
ENGINEERING IN 3D: Reservoir navigation innovations optimize wellbore placement
For an operator to maximize recoverable reserves, it is vital to accurately position wellbores with respect to planned targets within the reservoir. The process of positioning these wellbores becomes more difficult in horizontal wells with long lateral sections, three-dimensional (3D) profiles and/or laterally changing geologic conditions. Baker Hughes Inteq has integrated recent innovations in rotary steerable drilling technology, 3D visualization, and logging-while-drilling (LWD) to address wellbore placement under these more challenging conditions.
To lower uncertainties during a project's drilling phase, 3D visualization and geologic models are used during well planning to evaluate placement of the wellbore. In many cases, the well plan is either modified or planned entirely in the 3D geologic model. This becomes increasingly important for complex 3D well profiles. Forward modeling of LWD (logging-while-drilling) logs is also performed to better understand what responses are expected as the drilling assembly lands and drills through the target. This helps confirm the wellbore's position relative to significant geologic markers or boundaries.
During the drilling phase, the wellbore's position can be monitored against the 3D model in real-time. The LWD forward response models are revised as real-time data updates knowledge of the reservoir. These combined "real-time" wellsite or office-based activities are used to ensure the wellbore is properly landed and optimally positioned within the specified target zone.
Case history 1
On this North Sea well, planning began with the geoscience team selecting a number of targets defined by their location in 3D space. Then, the drilling team constructed a well plan to drill these targets, while taking into account engineering limitations such as torque and drag, dog leg severity (DLS), practical limitations of proposed drilling tools, and completion requirements. To achieve a well plan that meets both groups' needs, an iterative process of adjustments is commonly used before a definitive well plan is approved.
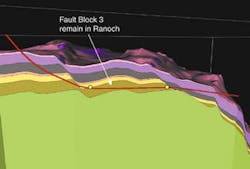
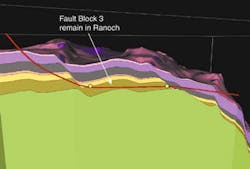
To improve efficiency and reduce time and costs involved in generating an approved well plan, the company integrated the well planning into the 3D earth model and the well was planned from the reservoir upwards. The operator defined the objective as a stratigraphic geological target within the Brent sequence, rather than a geometric target as is common in conventional well planning. In this case, the objective was to maintain the well within the Ranoch formation in Fault Block 3.
During a meeting between company staff and key operator geoscience and drilling personnel, the group fine-tuned the well path by ensuring that the well met the geological objectives while remaining within the operating constraints required for drilling and completion. This process kept planning time and costs to a minimum by eliminating at least 10 days from a typical planning schedule.
Drilling phase
A critical factor in the well's success was the Reservoir Navigation team recognizing the uncertainties inherent in the model. As with any drilling plan, the 3D model's geological uncertainty is dependent on both the interpretation and quality of the seismic data and the quantity and accuracy of data from offset control wells.
Borehole position uncertainty also is a significant factor that affects the accuracy of control well data and can introduce large lateral and true vertical depth (TVD) uncertainty in horizontal and extended reach wells.
During this project, the team supervisors were located in the contractor's office with a real-time data link from the wellsite to provide a live feed of LWD data during drilling. As LWD data identified geological horizons, the earth model was modified. Using the updated model, the team could determine whether any adjustments to the well trajectory were required and offered key offshore personnel a better understanding of formation/wellbore relationships.
Real-time transmission of updated data as well as synchronous viewing of the earth model between wellsite and office enhanced communication. Update of the 3D earth model to honor real-time data created confidence for positive decision-making, thus optimizing the wellbore and the success of the project.
Case history 2
In this Gulf of Mexico example, a horizontal well was planned to penetrate a thinly bedded sand/shale sequence on the outer reaches of a mature producing field. As a planning aid, the company constructed a 3D geologic model from the client's proprietary seismic data and the area's only offset well log data.
The well log data was used to differentiate between the cleaner sands and the inter-bedded shales within the main objective and to put the model on a well log scale. This is a critical factor in accurately placing wellbores in thin reservoirs and/or narrow corridors since, if you plan your well on a seismic scale, placement accuracy is ± wavelet resolution. In this case, the main objective was only 12 ft. thick.
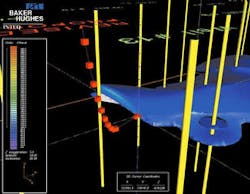
The 3D model's main feature was the northwest-southeast trending normal fault. Drilling would begin on the downthrown side of the fault and cross over the fault just above the top of the objective during the build section. After integrating the planned wellpath into the model, placement was evaluated relative to the main (orange) objective. The well was designed to penetrate the top of the objective along strike at an inclination of approximately 89 degrees. To achieve maximum exposure through the objective, the planned 1,000 ft. lateral section would drill down through the lobe and stop just prior to penetrating its base.
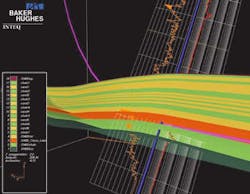
During planning, the well design team queried the model along the wellpath for information at the intersection point between the planned wellbore and each surface. These data (such as formation dip, dip azimuth, measured depth and geographic coordinates) were used during the landing phase of the horizontal drilling operation to ensure the wellbore remained on target. Additionally, the 3D model's 'cut and slice' and 'transparency' features allowed planners to view the wellbore position from any angle and confirm the position of the wellbore relative to critical reservoir boundaries. Additionally, LWD resistivity logs were modeled so logging responses were thoroughly understood prior to drilling.
During drilling, the modeled resistivity responses were correlated to the real-time logs to identify key marker beds during the horizontal landing phase. Once horizontal, the real-time LWD logs identified critical bed boundaries and allowed the driller to navigate within the cleanest sand interval. In this case, the well successfully penetrated the top of the objective and drilled down toward the base thus achieving maximum exposure in the reservoir for a lateral distance of 1,021 ft. After drilling, the MWD (measurement-while- drilling) and LWD data were imported into the 3D model to update it for future well planning purposes.
Conclusions
The addition of 3D visualization is fundamentally changing the way we do business. By planning wells directly in the 3D environment (with the entire multi-disciplinary asset team), operators can reduce both planning time and uncertainty by ensuring the planned wellpath meets drilling engineering, reservoir, and geological objectives.
Continuous updates to the 3D model are now possible during the drilling phase of a project. The model is updated in real-time with MWD/LWD data and displays the well path and logging data along the well path against the 3D geologic model. This greatly improves the overall awareness of the multi-disciplinary asset team during drilling and significantly adds value to the 'real-time' decision-making process.
Overall, 3D visualization promotes improved communication and facilitates team work by allowing multi-disciplinary assets to work more closely together with a single shared earth model from well planning all the way through drilling.
Acknowledgment
The authors wish to thank all operators who have allowed general reference to be made to their wells. Also, thanks go to Matt Benefield, Jim Coghill, Andy Poppitt and Glen Breaux for their contributions.
Authors
Jon Skillings is Senior Product Line Advisor for 3D Visualization/Reservoir Navigation, and has been with Baker Hughes Inteq since 1985.
Frank Hearn has worked for Baker Hughes Inteq for 17 years in various formation evaluation roles. He is the Global Product Line Manager for 3D Visualization and Reservoir Navigation.
References
Phillips, C., Clarke, D., An, L.; "Reservoir Exploitation Technology - 3D Modeling & Horizontal Wells," American Oil & Gas Reporter, September 1996.
