Increasing annular pressure and ECD are indicative of water flow influx when encountering shallow water flow sands.
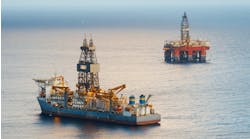
Deepwater exploration and production activity has seen significant growth in recent years. This growth can be attributed in part to the development of new technologies reducing operational costs and risks, and partly due to often-high productivity. Currently, there are about 90 publicly identified Gulf deepwater prospects.
These deepwater high production rates do not come without some serious risks. Oil companies face tremendous challenges to economically drill and complete deepwater wells. As the industry moves into ultra-deepwater, these technological and logistical challenges become increasingly difficult.
According to a recent United States Minerals Management Services (MMS) survey covering the last 14 years, shallow water flow (SWF) occurrences have been reported in about 60 Gulf of Mexico lease blocks involving 45 oil and gas fields or prospects. Problem water flow sands are typically found at depths from 950 ft to 2,000 ft, but some have been reported as deep as 3,500 ft below the seafloor. Frequently, these problems are due to overpressured and unconsolidated sands at shallow depths below the seafloor. They can lead to formation cave-in when uncontrolled water production occurs.
If an influx is severe enough, wells can be lost due to continuous water flow. Extensive washouts can undermine the large surface casing that is the major support structure for the entire well. Based on an analysis of 123 Gulf of Mexico deepwater wells, 24% could not be completed to the depth objective, 71% had flows but met objectives, and only 21% had no known problems. However, shallow water flows are not just a Gulf of Mexico issue. They have also been observed in the southern Caspian Sea, the Norwegian Sea, and in the North Sea.
SWF mechanisms
There are a variety of mechanisms that lead to the formation of SWF. The four main mechanisms identified are:
- Induced storage: This effect typically occurs below the 36-in. casing shoe, where the formation has been charged by drilling, running casing, or cementing of the previous string. The flow may last weeks, and is usually wispy in nature, decaying in time as storage is reduced. Fortunately, there is usually minimal erosion damage. Annular pressure-while-drilling measurements can help with the early identification of flow due to induced storage. It is recommended that the minimum possible kill mud weight is used to inhibit the flows, and that surge pressures are minimized while running casing.
- Geopressured sands: These zones are typically 1,200-2,000 ft below the mudline. In this case, the flow usually increases with time, and is accompanied by a significant accumulation of sediment at the wellhead. Detection of these geopressured sands can be aided by the identification of shallow sands in offset wells, and then generating seismic lines from the offset wells to the proposed well location. Several new techniques are being developed to identify features that correlate to geopressured sands from seismic sections. Identification is the best method of intervention. Anadrill's Annular Pressure While Drilling (APWD) tool can be used in conjunction with other logging-while-drilling (LWD) measurements to identify early onset of flow. All geopressured sands should be covered with tail cement, while ensuring excessive circulation is minimized.
- Pressure transmission: The flow due to pressure transmission is usually a delayed occurrence (typically two weeks after the section has been drilled). The overpressure can be significant enough to cause failure of the 20-in. shoe and flow behind casing. A good primary cement job is essential, and an accurate leak-off test (LOT) is necessary to predict the potential breakdown point of the weak zone.
- Induced fractures: These are typically located below the 20-in. casing point. The formation fails due to excessive pressures at the shoe during drilling operations. The surface flow manifests itself as either flow in the annulus or as a "volcano". The best method of intervention is an improved understanding of the fracture limits so that the mud weight, and more importantly, the equivalent circulating density (ECD) can be kept below the fracture initiation pressure. Thus, accurate LOTs at the location of the weakest point are essential.
Detection of SWF
Ring and button resistivities assist SWF intervention by reliably predicting hole size in formations with bed thickness greater than hole diameter.
In many deepwater wells, the first casing or conductor string is usually a 30 in. or 36 in. pipe. The next hole section, typically 24 in. or 26 in., is often drilled without a riser. In such top-hole sections, the drilling fluids and cuttings are returned to the seafloor, instead of being returned to the surface.
Standard operating practices in deepwater call for a remotely operated vehicle (ROV) with a camera to monitor flow coming out of the wellhead. Determining the severity of such flows using visual images can be tricky and unreliable. Accurate measurement of annular pressure provides a key tool in detecting and monitoring SWF.
Monitoring the ECD helps the operator assess both the depth and the severity of the water flow, and decide whether the flow is serious enough to stop drilling. Most conventional hydraulics models do not consider the effect of mud returns to the seafloor, and thus cannot accurately predict the expected ECD in these wells. A direct measurement of the mud pressure solves this problem.
APWD measurements can be used to identify shallow water flows, and serves as the primary indication of water flow, before any indications are seen by the ROV. Typically, there are no indications on surface when a water flow occurs, although there can be indications associated with an increase in surface torque or standpipe pressure due to increased debris in the annulus (see Hutchinson and Ward).
The following example demonstrates how the APWD tool can be used to detect the signature of SWF. In a deepwater well in the Gulf of Mexico, a water zone in sand A was encountered at X090 ft. The ECD suddenly increased in this zone as the sand was penetrated, indicating water, and possible solids entry. The rise in annular pressure and an ensuing visual confirmation of the mudline flow confirmed water entry. The increase was assessed to be manageable and drilling proceeded.
The same trends, increased ECD with a corresponding annular temperature increase, were seen in the lower section of the next sand, Zone B, and in the sand in Zone D below. The influxes were not severe, and were safely contained. Knowledge of the location and severity of the contained water influxes, and quick response to the early warning provided by the annular pressure measurement made it possible to continue drilling safely and successfully to the planned depth for this hole section.
Monitoring the real-time annular pressure will also enable heavy pills to be monitored as they pass into the annulus, and enable a dynamic kill to be performed if it is necessary (see Aldred). Real-time APWD measurements were combined with the surface standpipe pressure to monitor the process of the dynamic kill.
LWD resistivity solution
Severe shallow water flows can result in large hole washout and formation cave-ins. Accurate determination of hole size is critical for proper design of cementing operations. Inaccurate hole size determination can lead to unsuccessful cementing operations. This results from either underestimating or overestimating the annular volume. Extensive washouts can thus undermine the surface casing that is the major support structure for the entire well.
Historically, LWD tools are capable of computing borehole caliper. These caliper measurements have an upper limit of about 30-in. diameter. Much larger holes are used in the top-hole sections of deepwater wells and these are the sections most vulnerable to washout and SWF.
Extensive modeling of resistivity at the bit (RAB) information shows that the resistivity measurements can identify hole sizes beyond 60-in. with good accuracy. An inversion technique has been developed to compute a hole size from the measured RAB bit, ring, and deep button resistivities.
Figure 2 shows such a simulation. Track 1 shows the measured RAB resistivities for various bed thicknesses. The washout in each case is set to 50 in. Track 2 and Track 3 show the computed borehole diameter (Dh) and the inverted true resistivity (Rt). It is seen that the inversion provides with accurate borehole diameter when the bed thickness is greater than the hole diameter.
Acknowledgements
Thanks to John Lovell and Tom Bratton for their assistance on CDR and RAB caliper implementation, and I.M. Rezmer-Cooper for APWD data interpretation.
References
Hauser. B., "Opening Remarks: Shallow Water Flow Forum", Shallow Water Flow Forum, The Woodlands, Texas, June, 1998.
Alberty, M., Hafle, M.E., Minge, J.C., Byrd, T., "Mechanisms of Shallow Water Flows and Drilling Practices for Intervention", OTC 8301, 1997 Offshore Technology Conference, Houston, Texas, 1997.
Alberty, M.," Shallow Water Flow: History, Mechanism, and Intervention", Shallow Water Flow Forum, The Woodlands, Texas, June, 1998.
Hutchinson, M., Rezmer-Cooper, I.M., "Using Downhole Pressure Measurements to Anticipate Drilling Problems", SPE 49114, 1998 SPE Annual Technical Conference, New Orleans, Louisiana.
Smith, M.A., "Shallow Water Flow Distribution and Geological Controls", Shallow Water Flow Forum, The Woodlands, Texas, June, 1998.
Aldred, W., Cook, J., Bern, P., Carpenter, B., Hutchinson, M., Lovell, J., Rezmer-Cooper, I.M., Chu Leder, P., "Using Downhole Annular Pressure Measurements to Improve Drilling Performance", Oilfield Review, Winter 1998.
Rezmer-Cooper, I.M., Rambow, F.H.K., Arasteh, M., Hashem, M.N., Swanson, B., Gzara, K.: "Real-time Formation Integrity Tests Using Downhole Data", paper IADC/SPE 59123 prepared for presentation at the 2000 IADC/SPE Drilling Conference held in New Orleans, LA, 23-25 February 2000.
Rezmer-Cooper, I.M., Bratton, t., and Krabbe, H.: "The Use of Resistivity-at-the-Bit Images and Annular Pressure While Drilling in Preventing Drilling Problems", paper IADC/SPE 59225 prepared for presentation at the 2000 IADC/SPE Drilling Conference held in New Orleans, LA, 23-25 February 2000.
Niemann, J., "Shallow Water Flow Evaluation: Current technology and Capabilities", Shallow Water Flow Forum, The Woodlands, Texas, June, 1998.
Ward, C., "Pressure While Drilling: Shallow Water Flow Identification", Shallow Water Flow Forum, The Woodlands, Texas, June, 1998.


