Risk assessment mitigates potential loss
The oil and gas industry has always thrived on taking risks. That won’t change. What has changed are the tools that formalize the risk analysis process.
One of the greatest risks in deepwater is the risk of losing well control. A blowout from a high-rate deepwater well could be especially costly; some estimates are as high as several billion dollars.
Fortunately, statistics show that blowouts are rare. The US offshore oil industry averages only a few blowouts per 10,000 well completions. The majority of these events bridge quickly or are otherwise brought under control with only formation water and gas released, not oil. The probability of an extreme oil blowout is more likely in the range of only a few per million completions.
Despite the overall low likelihood of an offshore blowout, deepwater presents greater potential consequences and a greater likelihood of loss of control.
Considering the consequences
Gulf of Mexico deepwater reservoirs and modern completion methods permit several times the production rates that offshore wells achieved a decade ago. As much as 15,000 to 20,000 b/d of oil is common, and twice those rates is sometimes possible. A well’s uncontrolled flow rate “open flow potential” can be over 100,000 b/d. The blessing of high production rates carries with it the curse of high consequences when a blowout occurs.
Potential cost consequence is largely determined by probability that the wellbore will bridge, forming a downhole plug that blocks the flow of formation fluids to the surface. Downhole pressure is drastically reduced during a blowout, which causes formations to cave in, plugging the wellbore. Frequently, bridging occurs within a few hours or a few days. It has been theorized, however, that bridging may be less likely to occur in deepwater because pressure at the top of the well will not fall below seawater pressure. The large decrease in wellbore pressure that causes bridging might not occur.
A relief well is almost certain to be required if a blowout fails to bridge-over. The relief well must be drilled to pump kill fluid into the producing formation and blowout wellbore.
Blowout cost
Blowout consequence costs are mainly a function of oil spill volume and spill location. Spill volume can be estimated as spill rate times duration of the spill. If all control is lost, the spill rate is initially near the open flow potential for the well. It can take several weeks to locate and mobilize a mobile offshore drilling unit to drill a relief well. Some deeper wells require several months to drill to the objective producing zone, after which, it takes several days just to rig up the necessary equipment to perform the kill operations. A relief well kill operation would take at least two or three months and could require up to a year, which means the spill volume could be several million barrels.
The cost to clean up oil spill and outrage costs associated with lost sales and a tarnished public image can vary from a few hundred dollars per barrel to tens of thousands.
A joint industry project study sponsored by most of the major oil companies yielded a representative clean-up and outrage cost of about $2,500 per barrel for the Gulf of Mexico. Clearly, the potential consequence cost of an uncontrolled high-rate deepwater release requiring a relief well to control would total at least several billion dollars and possibly tens of billions of dollars.
Well control barriers
A well system’s primary function is to reliably contain, control, and transport hydrocarbons to the surface. Because leaks are inevitable, multiple barriers are usually essential to achieve adequate reliability. The objective is to achieve reliability commensurate with typical consequences of failures. Reliability, not the number of barriers, is the goal.
In the past, two typical well control barriers have provided adequate reliability. However, high flow rates common to deepwater completions could require improved reliability because of the greater consequences of a blowout.
Drilling/completion fluid hydrostatic pressure is the primary well control barrier for drilling and well intervention operations. When this fluid hydrostatic pressure drops below that of the formation, a kick occurs, which means that formation fluid enters the wellbore. Casing/wellhead and BOPs provide a back-up barrier to prevent a blowout when a kick occurs.
For production operations, a packer/tubing string and tree provide the primary well control barrier. The production casing and wellhead system provide a back-up barrier in case of a packer or tubing string leak.
It is especially challenging to achieve adequate well system reliability for deepwater operations. Subsea BOP control systems are more complicated and more vulnerable to failures than surface BOP controls. Detecting small leaks during periodic testing of an installed subsea BOP is less conclusive than surface stack testing because of the large volume of test fluid in a subsea system.
Deepwater systems that use surface trees have risers that extend the wellbore to the platform. Risers are exposed to dynamic forces and to a more corrosive environment than shallow-water casing systems. As water depth increases, riser reliability decreases because the more vulnerable casing risers must be longer.
Interestingly, the two-barrier rule of thumb is not always followed for deepwater operations. The connection between a subsea BOP stack and subsea wellhead provides only a single barrier, but history has demonstrated that these subsea wellhead connectors achieve a reliability level equivalent to most two-barrier systems.
One or more of three possible barriers controls flow up outer annuli of a well from intermediate depth formations:
Cement that is placed between casing strings and formation
Mud column hydrostatic pressure
Wellhead seals.
Cement sometimes is not circulated back into preceding casing strings in deepwater to avoid excessive annular pressure buildup (APB). Mud column hydrostatic pressure is at best only a temporary barrier because of riser loss and mud deterioration. Riser loss is the loss of mud column hydrostatic pressure when the marine riser and subsea BOP are removed. Mud density decreases are caused by settling of mud solids and seepage into permeable formations. In these situations, only a single barrier, the wellhead hanger/seal assembly, is active. Fortunately, a hanger/seal assembly system often provides multiple sealing elements that are quite reliable.
Hybrid deepwater well systems with a single casing riser provide two independent well control barriers in the production mode, the tubing-packer-tree and casing-riser-tree. However, when completing or working over these wells, the only barriers are the mud column and casing-riser-BOPs, which are not independent barriers. If the riser leaks or becomes disconnected, mud can flow out of the riser, leaving a reduced hydrostatic column that is insufficient to contain the flow of formation fluids.
Closing surface BOPs provides no control when a leak forms in a riser below the BOPs. Single casing riser operations have high risk because both probability and consequences of a leak are relatively high.
Clearly, it is important to carefully analyze deepwater well systems to ensure that adequate well component/barrier reliabilities are maintained. In some cases, an additional barrier is necessary to maintain adequate reliability and safety.
Deepwater risk analysis
Risk analysis techniques provide a means to estimate well system risks and reliabilities. The methodology to estimate the risk of a blowout has been around for many years. It is possible to estimate the probability of a leak by evaluating the well system components that comprise each well control barrier for each step of an operation. The probabilities of individual component leaks determine probability of a barrier failure.
Failure probabilities can be calculated using fault tree analysis for each configuration of components and barriers that exist during the life of a well. Probability of a blowout is the probability of failure of all well control barriers. All wells in a proposed field development scenario are evaluated to estimate the lifetime risk for alternative well system designs.
Comparing the estimated risk cost, riskex, capital costs, capex, and operating costs, opex, for the systems allows the operator to select the preferred alternative. These analyses are straightforward applications of well-established risk assessment tools and techniques.
Many falsely assume that when a system is designed and tested to function under a prescribed load, the probability of failure can be ignored if the load is not exceeded. In fact, most failures occur well below design load limits.
Connections, for example, sometimes have small flaws or damages that inspection fails to uncover. Testing is inadequate to detect minor leaks, so temperature, pressure, and load conditions cause small leaks to become large leaks. Interestingly, a large fraction of component failures results from operational factors rather than design or manufacturing defects. Risk and reliability analyses must consider these types of failures.
Reliability databases are most useful for systems such as mass-produced electrical components (i.e., resistors and capacitors) that are used in large quantities and under similar operating conditions. Most downhole components are few-of-a-kind and are used under varying operating conditions. These factors make it unlikely that a meaningful industry-wide statistical reliability data set can ever be developed. Expert judgment that considers component designs and operating conditions usually provides more realistic estimates of well system component reliabilities than statistical failure data.
Cost-benefit analyses
Almost every decision involves choices that cost something and have the potential for a benefit or a loss. Cost-benefit analyses help with decisions such as planned exploratory costs that are balanced against the potential benefits of increased reserves.
Many alternative field development scenarios and well design alternatives significantly affect risk of lost or deferred production, risk of having to repair or re-drill a well, risk of personnel injury, and risk of a blowout. Risk analyses are valuable evaluation tools for performing technical audits of new and novel well designs.
Risk analyses comprise formalized tasks performed by contractors and/or staff personnel. These risk analysis tools provide an organized methodology to combine scientific analysis, statistical data, and expert judgment into meaningful estimates of future outcomes.
There are many risk and reliability tools for predicting future effectiveness of alternative well designs.
Failure mode, effect and consequence analysis (FMECA), for example, evaluates well system design reliability. FMECA allows planners to identify failure modes of well system components and consider the consequences of failures for each well system component.
Similarly, planners use a hazard and operability study (HAZOP) to evaluate an operating procedure. HAZOP makes it possible to evaluate each step in a procedure and to consider consequences such as personnel injury, equipment damage, or lost time.
Fault Trees combine well system component reliabilities to estimate probability of a blowout.
Qualitative risk assessment
For a “quick and dirty” risk estimate, one can rank each event from high to low and the consequence of the event from extreme to minor in several steps.
An event is failure of a component or procedural step to achieve its desired function. For example, an event classified as high probability may be expected to occur once a year. A medium probability may be a failure once in 10 years, and a low probability once in 100 years. Each event is evaluated and categorized according to the perceived probability of occurrence and severity of the consequence.
This type of analysis is commonly used to evaluate risk associated with a new device, design, or procedure. A high-risk ranking (high probability and high consequence) can be a “show-stopper” that prevents a change from being made.
Unfortunately, this approach is somewhat subjective and can be manipulated to support preconceived notions and personal agendas. Even an independent analyst is challenged in making an unbiased assessment; it’s just too easy to “push the rankings” a step or two to satisfy the natural tendency to biases.
Another way that unacceptable “show stopper” rankings are avoided is to separate a system into small enough components, or an operation into small enough steps, so that no single item is unacceptable.
A conclusive evaluation requires that total risk from all steps of an alternative operation be compared to the total risk of all steps of another alternative. Likewise, a risk assessment must consider more than just a few items that appear to be the most critical. Several moderate-risk events can total as much as some high-risk events.
Despite its potential vulnerabilities, qualitative risk assessment is a valuable tool for quickly capturing input from people with diverse backgrounds to provide a general overview for decision making.
Quantitative risk assessment
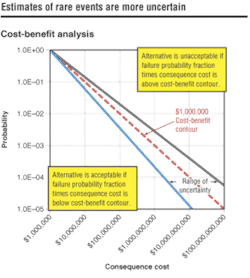
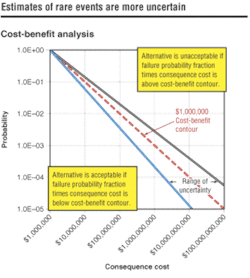
A more detailed analysis quantifies probability of failure and consequences of that failure to provide a cost-benefit analysis. Riskex is determined as probability multiplied by consequence cost.
For example, a proposed well design alternative is expected to save $1 million in capex and opex. The new design or operational procedure is considered worthwhile when additional riskex, when plotted, is below and to the left of the line, in other words, when expected increase in riskex is less than the $1-million-dollar decrease in capex and opex.
Reliability data are scarce for events with low probability and high consequences. Uncertainty in the cost-benefit contour line is much greater at the low probability region. The capex estimates are usually more accurate than other costs. Opex estimates are less certain than capex, but are known more accurately than riskex. A simple summation of these costs can be misleading or inadequate. More comprehensive analysis allows specific factors that influence risk to be evaluated. It can be possible at times to reduce risk by increased monitoring and better quality control.
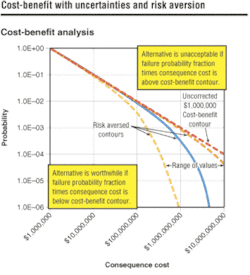
Sometimes cost-benefit analyses should use risk aversion factors. For example, one-chance-in-a-thousand probability of failure may be acceptable for a failure that results in a costly repair, but the acceptance level for personal injury or loss of life is likely to be much lower, regardless of the financial cost.
Operations can be improved when people are encouraged to take calculated risks. However, encouragement to take risks should be qualified with the stipulation that potential consequences of failure are limited. A person should be expected to manage risks that are within their authority limits, but should not take risks with potential consequences greater than those limits.
A deepwater drilling manager might be encouraged to make decisions that could risk up to a million dollars. Accepting a design alternative with significant risk of a blowout, on the other hand, should require approval of a much higher management team. There is clearly a need for government-level regulations and procedures that prescribe risk assessment requirements for dealing with such eventualities. A blowout or loss of life impacts everyone and tarnishes the image of the whole industry.
Author
Riley Goldsmith, PE, has over 40 years of experience in all phases of drilling and is a member of SPE, AADE, and API. He serves on the OTC technical program committee and advisory boards of Pennwell DTA Forum and AADE DIG. [email protected].
