New cost metrics can be used to help predict decommissioning liabilities
Editor's note: This article first appeared in the July-August 2023 issue of Offshore magazine. Click here to view the full issue.
By Mark J. Kaiser, Louisiana State University
In part one of this article (Offshore May-June 2023), we showed how the valuation of reserves (known as the standardized measure, STM) and asset retirement obligations (AROs) for oil and gas companies were closely correlated with production.
Here in Part 2, we introduce two new unit cost metrics that normalize asset retirement obligations by production and well count, and tabulate these statistics for integrated, primarily onshore, and also primarily offshore producers.
We then extrapolate the group statistics and estimate the present value of worldwide oil and gas decommissioning liability between $311 and $362 billion c.2022, about evenly split between onshore and offshore requirements.
Variables
For this analysis, asset retirement obligations (ARO), net wells (Wells), crude oil and natural gas production (Production), and the Standardized Measure of Proved Reserves (STM) were tabulated for a sample of integrated and independent companies for the year ending Dec. 31, 2021.
Production is reported in barrels oil equivalent (boe) and includes the contribution of both crude oil liquids and natural gas produced at the wellhead and converted on a heat-equivalent basis using a 6:1 volume ratio (6 Mcf = 1 boe). Liquids includes crude oil, shale/tight oil, oil sands, bitumen, lease condensate or gas condensates. Well counts are described as wells producing and capable of producing.
As new wells are added to an operator’s portfolio (by drilling or acquisition), AROs will increase incrementally, while wells that are plugged or sold will decrease ARO incrementally. Addition of new assets (new liabilities), sales (fewer liabilities), and decommissioning activity (fewer liabilities) combine to describe how AROs vary from year-to-year, normally no more than 10-20% annually due in large part to the dampening effect of their cumulative liabilities. Changing market conditions (supply/demand) and new price/cost estimates also influence how ARO estimates are calculated.
Well counts change with normal business operations, acquisitions, and divestiture, but generally do not change significantly on an annual basis because of the (normally) large number of wells in inventory. Wells producing and capable of producing include temporarily closed (suspended) and shut-in wells. Outside the US and FASB guidelines, well counts are usually not reported, so ARO metrics that normalize by well count are only possible for a subset of the collected data.
STMs are strongly dependent on oil and gas prices and can vary by 50% to 100% or more year by year depending on how oil prices change. If oil prices change by ±p% between periods, STMs will change approximately ±p%, and metrics involving STM will see similar changes. For international companies using IFRS (International Financial Reporting Standards), STM values and wells are usually not reported.
Normalized measures
Normalized measures of ARO divide ARO by production and well count, and compare ARO relative to the value of the standardized measure of reserves.
The metrics include two unit costs and one ratio:
- ARO/Wells ($/well)
- ARO/Production ($/boe)
- ARO/STM (%).
ARO per boe production and ARO per well count represent all-inclusive cost indices, and can be used for comparative analysis. As a percentage of STM, ARO/STM gives an indication of the size of future retirement cost relative to the value of proved reserves.
ARO/Wells and ARO/Production are more stable year-to-year compared to the ARO/STM ratio since well counts and production do not significantly change year-to-year and ARO only weakly depends on oil prices, while STM is strongly dependent on oil prices. Note that both the numerator and denominator terms in the ARO/STM ratio represent discounted present values.
Also, the components of the ARO/Wells and ARO/Production metrics generally move in the same direction (up/up, down/down) which further stabilizes the ratio. ARO/Production is somewhat analogous to production, finding and development cost, since companies with a low per barrel retirement obligation are likely to be valued somewhat higher than companies with a high retirement obligation because of its impact on cash flows, project profitability, financial risk and perception of market participants.
ARO/STM statistics are of secondary interest in this discourse because they represent an operational metric. Generally, ARO/STM ratios in the range from 10-40% are expected for ongoing concerns, and outside this range, one should scrutinize company data more closely.
Low values of ARO/STM might be due to management underestimating ARO or low-cost onshore producers, and although we cannot discount the possibility of unusually inexpensive decommissioning requirements (e.g., company with only shallow onshore gas wells), ratios below a few percent remain suspect. High values of ARO/STM likely denote complex decommissioning projects with expensive requirements in deepwater, remote and harsh environments, and/or near-term retirement commitments.
Integrated companies
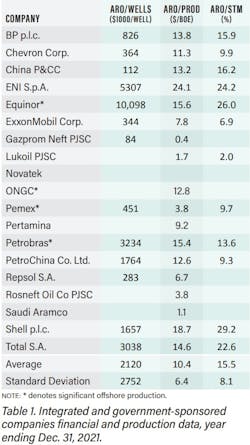
AROs range over an order-of-magnitude from about $1.4 billion (Gazprom, Lukoil, Repsol) to $22 billion (Shell), and annual production ranges from 209 MMboe (Repsol) to 4.5 Bboe (Saudi Aramco). STMs range from a few tens of billions of dollars (Pemex, $36 billion) to $220 billion (PetroChina). Well counts fall between about one thousand at the low end (Equinor, 1,119) to several tens of thousands at the high end (Chevron, 35k; China Petroleum & Chemical Corp., 56k).
Normalized well statistics range from $84,000/well (Gazprom) to $10 million/well (Equinor), and on a production basis, AROs range from $0.4/boe (Gazprom) and $1.1/boe (Saudi Aramco) to $24.1/boe (Equinor), as shown in Table 1. As a percentage of the standardized measure of reserves, AROs fall between 2% (Lukoil) to 26% (Equinor).
The average ARO/Wells statistic for the sample is $2.1 million/well with a standard deviation of $2.8 million/well, indicating significant variation, while the standard deviation for the ARO/Production and ARO/STM statistics are about half the sample average, indicating better behaved statistics (Table 1, bottom row).
Average ARO/Production for integrated and government-sponsored enterprises is $10.4/boe with standard deviation $6.4/boe. Average ARO/STM is 15.5% with standard deviation 8.1%. Excluding Saudi Aramco and the four Russian companies, ARO/Wells and ARO/STM statistics do not change because they are not reported, and only the unit production cost (which is reported) increases from $10.4/boe to $12.8/boe.
Equinor and Eni have the highest ARO well cost in the group at $10.1 million/well and $5.3 million/well, respectively. Equinor derives almost all their production offshore Norway in a harsh high-latitude environment, and the Norwegian government imposes strong regulatory burdens and environmental requirements in development. Eni also has many high-cost projects in extreme regions worldwide which contributes to its high ARO well cost. Third on the list is Petrobras ($3.2 million/well), another exclusively offshore operator which gathers the vast majority (>90%) of its production offshore deepwater Brazil. TotalEnergies operates in many high-cost southern and northern hemisphere environments worldwide (e.g, Arctic, Tierra del Fuego, Caspian), onshore and offshore, and has ARO well cost of $3.0 million/well.
At the opposite end of the cost spectrum, Gazprom has the lowest ARO well cost at $84,000/well. Gazprom operates throughout the cold, harsh Russian hinterland and is primarily an onshore producer, so its low values may be reasonable. Next, China Petroleum & Chemical, also primarily an onshore domestic producer, reports ARO well cost at $112,000/well, followed by Spain’s Repsol ($283,000/well), ExxonMobil ($344,000/well), and Chevron ($364,000/well). ExxonMobil and Chevron are widely regarded as the most efficient and disciplined companies in the oil patch, and their favorable ARO metrics reflect this reality.
On a production basis much the same story holds, but because production is reported by all companies in the sample, a more complete picture emerges. Eni has the highest ARO production cost ($24/boe), followed by Shell ($19/boe), Equinor ($16/boe), and Petrobras ($15/boe). TotalEnergies, BP and China Petroleum & Chemical round out the top of the list at about $14/boe each. Shell is involved in numerous deepwater field developments around the world, and in recent years has been orienting toward gas and LNG.
Low ARO cost producers are Gazprom ($0.4/boe) followed by Saudi Aramco ($1.1/boe), Lukoil ($1.7/boe) and Rosneft ($3.8/boe). Although these values are very low, they may be reasonable considering the high levels of onshore production for each of the companies. Pemex reports normalized ARO cost of $3.8/boe, which probably reflects an underestimated ARO (perhaps by a factor of five or more) since a significant amount of its production is offshore oil which would not suggest such values.
ARO/STM ratios are subject to greater year-to-year change than the two cost metrics because STM changes in step with oil price changes whereas AROs are much less sensitive. An average value of 15.5% ARO/STM for integrated companies indicates that in 2021 about one-tenth the value of company reserves were tied up in AROs. ARO/STM values ranged from 2% (Gazprom) to about 20% (Shell).
Independent companies: primarily offshore
AROs totaled $47.1 billion based on 2.03 Bboe production, or in aggregate $23.4/boe. One would expect offshore independents to have larger ARO production cost compared to integrated (mixed production) companies, and indeed, offshore independents produced about ten times less than integrated companies (2 Bboe vs. 22.7 Bboe), while their AROs were only about one third as small ($47 billion vs. $172 billion).
Offshore independents produce less than integrated companies, operate well portfolios that are less productive, and reside in a higher-cost (offshore) environment, all of which will contribute to a high ARO production metric. Smaller production and reserves volumes will also typically translate into smaller reserves valuations.
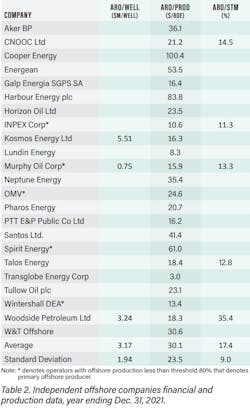
There is a large range of data in the sample, with the two low-cost operators being Transglobe Energy ($3.0/boe) and Lundin ($9.8/boe), and the two high-cost operators being Harbour Energy ($84/boe) and Cooper Energy ($100/boe). Harbour Energy was formed from the merger of Chrysaor and Premier Oil in 2021.
The average group statistic was $30.1/boe, about three times larger than integrated companies ($10.4/boe), with a standard deviation of $23.5/boe (Table 2, bottom row).
Eight operators had ARO production cost between $10-20/boe: INPEX, $10.6/boe; Wintershall, $13.4/boe; Murphy Oil, $15.9/boe; PTT E&P, $16.2/boe; Kosmos Energy, $16.3/boe; Galp Energia, $16.4/boe; Woodside Petroleum, $18.3/boe, and Talos Energy, $18.4/boe.
Seven operators ranged from $20-40/boe: Pharos Energy, $20.7/boe; CNOOC, $21.2/boe; Tullow Oil, $23.1/boe; Horizon Oil, $23.5/boe; OMV, $24.6/boe, W&T Offshore, $30.6/boe; Neptune Energy, $35.4/boe; Aker BP, $36.1/boe.
One would expect normalized ARO cost for onshore wells in temperate environments to be smaller than onshore wells in more extreme environments, which should be less than platform wells in shallow water, and less than deepwater wells, on average. Since (most) integrated and offshore companies have a diverse well portfolio, we cannot readily breakout well types and reach more useful conclusions, but the chain of rankings should still be valid.
STM values and well counts are only reported for a handful of companies, and the composite/average statistics computed ($1.16/3.17 million/well, 14.9/17.4%) cannot be considered representative. ARO well cost for offshore producers is about 1.5 times larger than integrated companies ($3.2 million/well vs. $2.2 million/well), while the ARO/STM statistic is comparable (14.9% vs. 15.5%).
Independent companies: primarily onshore
ARO for the sample totaled $18.5 billion based on 3.7 Bboe production and 87,777 wells. Primarily onshore companies produced more than primarily offshore producers (3.7 Bboe vs. 2.0 Bboe) with less than half of the total ARO ($18.5 billion vs. $47.1 billion).
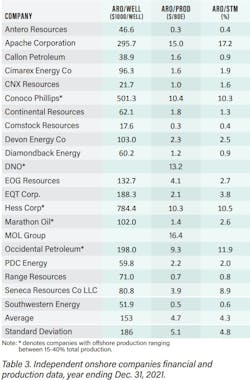
Average statistics for the sample are $153,000/well, $4.7/boe, and 4.3% ARO/STM (Table 3). The composite averages are $198,000/well, $4.8/boe, and 5.3% ARO/STM. There is not much difference between the composite and average metrics because there are few outliers. There is significant variation across all the normalized measures, however, due to the different business models and operational specializations within the group.
For companies with offshore production, ARO per barrel ranged from $9.3/boe (Occidental Petroleum) to $13.2/boe (DNO). For onshore producers, four companies had ARO per boe less than $1/boe: Antero Resources ($0.3/boe), Comstock Resources ($0.3/boe), Southwestern Energy ($0.5/boe), Range Resources ($0.7/boe). Eight companies had ARO per boe values between $1 to $3/boe: CNX ($1/boe), Diamondback Energy ($1.2/boe), Marathon Oil ($1.4/boe), Callon Petroleum ($1.6/boe), Cimarex Energy ($1.6/boe), Continental Resources ($1.8/boe), EQT ($2.1/boe), PDC Energy ($2.2/boe), Devon Energy ($2.3/boe).
ARO per producing well for Conoco-Philips ($501,000/well) and Hess ($784,000/well), companies with offshore production, are significantly greater than for most other onshore companies as one would expect, but not excessively so for Occidental Petroleum ($198,000/well) and Marathon Oil ($102,000/well). Apache, EQT and EOG Resources also have high ARO well cost ($296,000/well, $188,000/well and $133,000/well, respectively). The majority of (pure) onshore producers have ARO metrics ranging between $20,000 to $80,000 per well.
ARO as a percent of STM averaged 4.3%. Three of the four companies with the largest ARO/STM ratios are offshore producers, and the company with the largest ratio (Apache, 17.2%) was once a primarily offshore producer.
Onshore+
If Saudi Aramco and the four Russian companies are included with the onshore sample (“Onshore+”), all the group average metrics move downward. The composite ARO/boe metric is reduced to $2.3/boe because of the large production position of the new entrants and their small reported AROs, whereas the average ARO/boe statistic is reduced less to $4.3/boe because of equal weights used in averaging. There is no change in the ARO/Well statistic because none of the companies in the expanded sample report this data.
World ARO estimate circa 2021
Circa 2021, 50.7 billion boe was produced worldwide: 28 Bbbl crude oil and condensate, 3,854 billion cubic meters. Offshore wells provided about one-third of the total oil and gas production in the world.
Using the ARO unit production statistics, the ARO under the 70/30 onshore/offshore production distribution is calculated to range from $311 billion to $362 billion.
The low-cost scenario assumes $4.3/boe for onshore decommissioning and $10.4/boe for offshore decommissioning based on average ARO cost statistics derived from onshore independents (Onshore+) and integrated companies, respectively. The high-cost scenario assumes $4.7/boe for onshore decommissioning and $12.8/boe for offshore decommissioning derived from onshore independents and integrated (Integrated-) companies.
Under the current onshore/offshore production distribution, the model indicates that global onshore ARO is slightly greater than offshore ARO at both the low and high-cost scenarios. Offshore wells and structures are much more expensive to abandon than onshore infrastructure but onshore wells are many times more numerous, which balances the cost distribution.
If offshore production plays a larger role in the future, or if the estimates of current offshore production are underestimated, then the ARO cost range shifts upward and the offshore region would play a larger role in expenditures. Conversely, if current onshore production estimates are underestimated or play a larger role in the future production, the ARO cost range would shift downward, with onshore activity playing a larger role.
About the author
Mark J. Kaiser, Center for Energy Studies, Louisiana State University
About the Author

Mark J. Kaiser
Center for Energy Studies
Mark J. Kaiser is Professor at the Energy Institute at Louisiana State University. His research interests cover the oil, gas, and refining industry, and relate to cost assessment, fiscal analysis, infrastructure modeling, and valuation studies. Kaiser has led several studies and published extensively on decommissioning in the Gulf of Mexico. He holds a Ph.D. from Purdue University.


