Safer, more effective deep-target drilling improves pre-drill risk assessment
Subsurface HP/HT visualization
Stephen A O¿Connor, Richard E Swarbrick; GeoPressure Technology
High pore pressure conditions are now relevant to many exploration areas around the world as the oil/gas industry continues to drill deeper targets. Some of the most extreme conditions are found in areas such as the Deep Shelf Gas Play of the Gulf of Mexico (expected pressures >30,000 psi, 2,000 bars) and the Central North Sea.
High pressures in deepwater settings are also a major technological challenge, where mud columns originate on the rig and mud pressures are already high when the rock system is penetrated below the seabed.
High pressures result from both rapid sediment loading (as in tertiary deltas, including Mississippi, GoM; Nile Delta, offshore Egypt; Niger Delta, offshore Nigeria; Baram Delta, offshore Borneo; and Orinoco Delta, offshore Trinidad) and the many changes to rocks and fluids at elevated temperatures (>220°F; 100°C).
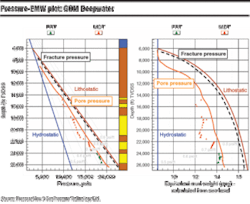
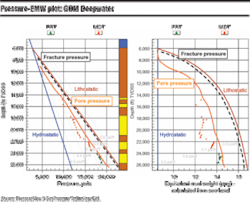
A well plot from the Mississippi Canyon area of the GoM, indicates the principal rock types (sand reservoirs in yellow; shales in brown), pore pressure, fracture gradient predictions, and the many pressure measurements taken in the multiple reservoir horizons using wireline-conveyed RFT and MDT tools.
In deep water, the top of overpressure (pore pressures higher than normal) is closer to the seabed/mudline than on the shelf, due to the abundance of very fine-grained sediments surrounding the reservoirs (areas such as West Africa, GoM, Brazil, and SE Asia). Everywhere, when pore pressures increase above normal, the drilling margin becomes narrower, and at high pore pressures casing design and well control issues predominate with associated increase in well cost.
Pressure prediction
Prediction technology for pressures is based on porosity trends (e.g., seismic velocities using the Eaton and/or equivalent depth methods, or applied to petrophysical wireline and MWD/LWD data such as sonic, resistivity, and/or density logs), and calibrated against direct pressure measurements such as repeat formation test (RFT), modular formation dynamics test (MDT), and drillstem test (DST) data.
In deeper targets, these porosity-based relationships are less reliable, and there is more dependence on the available pressure measurements from offset wells. The value of these data in deep, high-pressure areas is therefore extremely high, since these measurements may be the only indications of high pressures, coupled with mud weight data.
Well design, preparatory to cost and environmental risk assessment, involves display of the pore pressure and fracture pressure predictions for the planned well, from the surface to total depth (TD).
These predictions are compiled from the estimations based on porosity trends, where applicable, and will invariably show the direct pressure measurements from relevant offset wells: RFT, MDT, and DST data for pore pressure gradient, and leak-off test (LOT) and formation integrity test (FIT) data for the fracture gradient.
It is possible that uncertainty in the predictions will also be displayed. Mud weights may be shown, especially where direct measurements in offset data are scant or absent.
Pressure plots
Pressure-depth plots are preferred as the display tool of geoscientists, since these plots can be used to establish: (a) the magnitude of abnormal pressure, (b) slope of fluid gradients (for oil, water, and gas) in the reservoirs related to fluid density, (c) position and thickness of pressure transition zones (sealing rocks), and (d) relationship between pore pressure and rock type.
A well was plotted from the Mississippi Canyon area of the GoM that indicated the principal rock types (sand reservoirs in yellow; shales in brown), pore pressure and fracture gradient predictions, and the many pressure measurements taken in the multiple reservoir horizons using wireline-conveyed RFT and MDT tools. Also included in this well plot was the lithostatic or overburden curve.
Pressure-mud weight plots, by contrast, are the usual display of the relevant data for a well plan, involving a mud weight program and casing design, and preferred by drilling engineers.
The horizontal scale is now equivalent mud weight (EMW), and the available drilling margin is the difference between the pore pressure and fracture gradients. The drilling margin is further reduced when the operational requirements are taken into consideration: (a) the need to drill with a mud weight in excess of the pore pressures (commonly 0.5 ppg), and (b) the higher equivalent circulating density (ECD) when mud is being pumped down the well during drilling (commonly 0.5 ppg).
The drilling margin can be exceedingly narrow and some areas of high pressure are not possible to drill with current technology. If the mud weight exceeds the fracture strength of the exposed rock below a cased hole section, the rocks will fracture, leading to mud losses and, if not rectified, reduced well control. Reduction of mud weight to below the pore pressures results in fluid influx (a mud gain and/or well kick) and requires increase in mud weight to regain control of the well.
Visualization
Increased benefits come from visualization of the available data on pressure-depth and pressure-mud weight plots. Plots of data compiled from more than one well (multi-well plots) permit recognition of pressure compartments in the subsurface. The same amount of overpressure (difference between pore pressure and hydrostatic gradient) can be used to demonstrate reservoir continuity or connectivity across a continuous reservoir zone, or through lateral/vertical drainage via reservoirs and faults/fractures.
The difference between pore pressure and fracture gradients at the crest of a reservoir structure can be used to assess the risk of seal breaching, when hydrocarbons migrate to another part of the rock sequence, having fractured their seal. Pressure-depth plots are the route to visualization and quantification of this relationship.
As drilling in high-pressure and “beyond” conditions becomes routine worldwide, the need for precise visualization of relevant data is greater than ever, and the organized assembly of all rock and fluid data into a well plan is required for prediction ahead of the bit to prevent abnormal pressure surprises.
A recent upgrade in the software suite has advanced analytical and annotation features, and with its accompanying database structure, can display the required pressure-depth plots, which in turn can be converted into overpressure-depth and equivalent mud weight-depth plots for well planning purposes.
As the industry achieves new records in terms of depths, pressures, and temperatures, careful and rigorous planning using pressure data and pressure visualization software will hopefully lead to safer and more effective deep-target drilling. Visualization also allows the integration of pressure data with geological processes to improve pre-drill risk assessment.•
Stephen A O’Connor [[email protected]]
Richard E Swarbrick [[email protected]]
A well plot from the Mississippi Canyon area of the GoM, indicates the principal rock types (sand reservoirs in yellow; shales in brown), pore pressure, fracture gradient predictions, and the many pressure measurements taken in the multiple reservoir horizons using wireline-conveyed RFT and MDT tools.
