SEISMIC TECHNOLOGY: Combining P-waves with C-waves yields deepwater resolution advantages
The numerous discoveries in deepwater basins around the world are well documented within the industry. Many of these discoveries are entering the appraisal and development stages when important long-lasting investment decisions are made. The more one knows about the reservoir, the more likely a cost-efficient development strategy can be applied. Seafloor seismic tech-nology can provide this additional insight and help maximize the value extracted from each reservoir at less cost and with reduced risk.
The subsurface image used in drilling these deepwater discovery wells typically has been supplied by towed streamer 3D seismic data. This image, perhaps refined by target-oriented reprocessing, may be sufficient for the placement of appraisal wells and the initial development of the field, provided the overburden isn't particularly complicated.
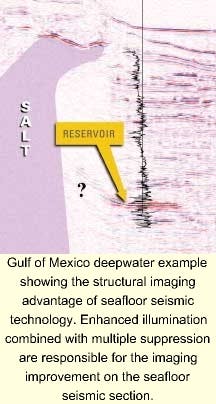
When complex structures with large velocity contrasts are present, for example when imaging under and around salt bodies, 3D pre-stack depth migration is often used in an attempt to focus the reservoir image. However, for a growing number of deepwater discoveries, the illumination of the reservoir afforded by towed streamer seismic data is inadequate. The end result is that iteration after iteration of the most advanced 3D pre-stack depth migration algorithms fail to yield a reservoir image that can be interpreted with a reasonable degree of confidence.
When drilling appraisal wells that typically cost $30-50 million, and in worst cases exceed $100 million, a good reservoir image is needed for optimum well placement and risk reduction. Just as important is the need to reduce uncertainty in reserve estimates so that production facilities can be right-sized.
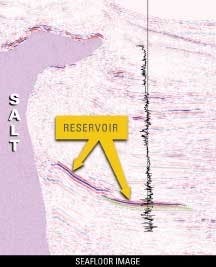
An under-sized production facility that must be enlarged when reservoir reserves are upgraded can have the same negative financial impact as in non-profitable or smaller than expected reservoirs with over-sized facilities. The recent advancement of seafloor seismic technology to water depths exceeding 2,000 meters provides the opportunity to reduce reservoir uncertainty and risk in the appraisal and development stages of deepwater fields. In areas characterized by complex structures, the improved illumination afforded by the seafloor seismic method can dramatically improve the reservoir image.
Wide-azimuth illumination
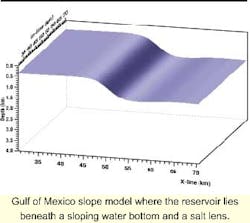
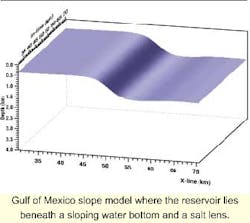
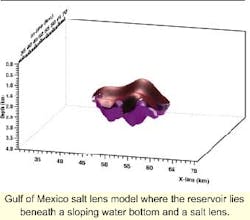
A subsurface model was constructed analogous to the situation encountered with some Gulf of Mexico deepwater prospects, where the reservoir is located beneath a sloping water bottom and a salt lens. In the model, the reservoir was a flat reflector at a depth of 4 km. The layers above the reservoir (water, sediment, salt, and more sediment) had different but constant velocities.
The model was 8 km in length and width, and 4 km deep. Water depths ranged from 0.4 km to 1.4 km. The top of the salt varied in depth from 1.5 km to 2.2 km. The base of the salt varied from 1.9 km to 2.8 km. The salt wedge was 3.6 km in diameter. Using this model, the authors compared how a narrow-azimuth streamer survey and a wide-azimuth seafloor seismic survey might illuminate the reservoir at the base.
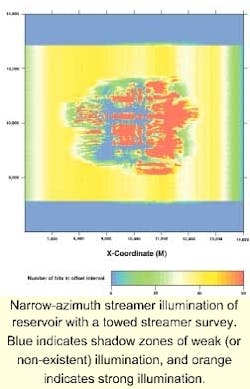
The illumination analysis was performed with 3D raytracing, which utilized wavefront propagation to obtain full 3D results. In the streamer design, a dual source/6-streamer configuration was evaluated. The streamers had 25-meter group intervals, were 4 km in length, and were separated by 100 meters. The dual sources, separated by 50 meters, flip-flopped every 25 meters.
The source-to-receiver raypaths spanned a narrow range of azimuths. In the seafloor seismic design, a dual-cable orthogonal patch was analyzed. The cables had 50-meter group intervals, were 8 km in length, and were separated by 400 meters. The orthogonal source lines, separated by 400 meters, were 8 km in length with 50-meter shotpoint intervals. This produced a wide range of azimuths.
The data was gathered into 25 meter by 25 meter bins, with the maximum offset limited to 4,200 meters, the approximate depth of the reservoir. This generated 40-fold streamer and 60 to 80-fold seafloor seismic data. From an illumination standpoint, this fold difference is insignificant.
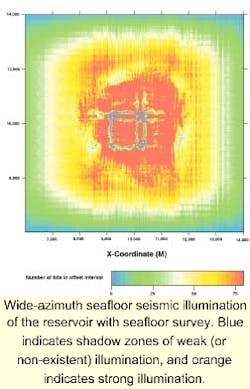
From the vast expanse of blue (weak or non-existent illumination) in the figure, it is apparent that shadow zones are widespread. This is due primarily to ray bending in the complex velocity field of the overburden. Rays that reached the blue zones were deflected away from the streamer spread and never captured on their return to the surface.
In this situation, 3D pre-stack depth migration would fail. It cannot fill in shadow zones where little or no data exists (Muerdter and Ratcliff, 2000). The reservoir could not be appraised and developed with confidence.
The adjacent wide-azimuth figure is dramatically better. The reservoir is bathed in orange, indicating a widespread area of strong illumination. The blue shadow zones have been minimized. The true 3D nature of wide-azimuth seafloor seismic has properly imaged the reservoir. 3D pre-stack depth migration would be successful here, and the reservoir could be appraised and developed with much greater confidence.
This model study highlights a problem with narrow-azimuth streamer acquisition that has been understood for some time: interpretation of a prospect can be influenced by the shooting direction. O'Connell et al. (1993) pointed this out in what has become the famous Bullwinkle experiment.
Krail (1994) showed the value of wide-azimuth illumination of potential reservoirs in geologically complex areas (using vertical cables). In recent years, a number of authors have followed and broadened our understanding of the value of wide-azimuth imaging.
At this point, it is worth considering the alternatives for acquiring wide-azimuth seismic data. One option that has been considered, but never actually used, is shooting a multitude of conventional narrow-azimuth towed streamer surveys, oriented at angles that span 360 degrees. These overlapping surveys would be combined in processing. While this approximates wide-azimuth acquisition, it may require shooting as many as 8-12 different orientations for this approximation to be valid in complex velocity regimes.
Marine vertical cable is another acquisition technique that has been used to record wide-azimuth seismic data. In vertical cable surveys a dense grid of shots is fired into a coarse grid of receiver cables positioned vertically in the water column (Krail, 1994). This technique is ideal for wide-azimuth illumination, but the seafloor seismic method has three distinct technical advantages over it and the multiple streamer survey approach.
Seafloor seismic advantages
Two advantages of seafloor seismic technology involve water-column reverberations. First, the ability to suppress water-column reverberations through P-Z summation of seafloor seismic signals is well documented (Barr and Sanders, 1989). This takes on added significance in deepwater environments.
In what some have called a seismic manifestation of "Murphy's Law," the first water-column multiple on streamer sections often interferes with the reservoir, obscuring interpretation. Time-consuming de-multiple techniques often are only marginally effective at preventing this, and they also incur the additional risk of attenuating the reservoir image.
On the other hand, P-Z summation of seafloor seismic data is a much simpler, more powerful solution. It not only achieves greater multiple suppression, but it does so at the vastly reduced risk of attenuating the reservoir image.
The second advantage related to water-column reverberations is the higher bandwidth that accompanies P-Z summation, as noted by Barr (1997) and others. Seafloor seismic data tends to have higher frequencies than streamer data because the receiver ghost notch, which has been attenuated on seafloor seismic data, remains on streamer data.
For example, a streamer towed at a depth of 10 meters has a theoretical notch in its amplitude spectrum at approximately 75 Hz, with a significant roll off in amplitude at nearby frequencies. Seafloor seismic data does not suffer from this limitation. It can also be richer in the lowest frequencies due to the contribution of the vertical geophone data.
The third advantage of seafloor seismic surveys is the ability to simultaneously record both compressional (P-waves) and mode converted shear wave data (C-waves when describing mode conversion at the reflector). The wide-ranging benefits of multicomponent (4C) recording have recently been documented by numerous authors.
In general, these benefits fall into three main categories - imaging, reservoir characterization, and drilling hazard identification. By far, the widest application to date has been in imaging, specifically in peering through gas clouds (Cafarelli et al., 2000, and others). Imaging transparent reservoirs is another successful application of the technology (MacLeod et al., 1999).
In the area of reservoir characterization, lithology and fluid prediction applications have been shown (Fromyr et al., 2000, and others). Zhu et al. (2000) distinguished fizz gas from commercial gas. Shear wave splitting has been used to delineate fractured reservoirs and optimize their development (Li, 1997). For drilling hazards, 4C data may reveal sands that are likely to experience shallow water flows due to their unusually high compressional-to-shear velocity ratio (Castagna, 2000).
Quantifying the value
In this presentation, the authors focused on technical issues and ignored financial considerations. Today seafloor seismic technology is often viewed as too expensive. This perception is understandable if one's only benchmark is the cost of towed streamer seismic data. To put the cost of seafloor seismic as an appraisal and development tool for deepwater fields in perspective, consider the following back-of-the-envelope calculations for a hypothetical field with estimated recoverable reserves of 200 million boe.
At $14/bbl, the field is worth $2.8 billion. Assume it covers a 49 sq km area (7 km by 7 km), and to image it properly, a 7-km migration aperture on all sides is required. Consequently, we must acquire seismic data over a 441 sq km area (21 km by 21 km). A seafloor seismic survey for that area might cost somewhere in the neighborhood of $28 million.
This cost is equivalent to 1% of the value of the reserves. It is similar to the cost of drilling a single deepwater well. From a development standpoint, it pales in comparison to the massive amount of investment that would be needed to upgrade an undersized facility. Net present value (NPV) analysis, while difficult to do precisely without intimate field knowledge, shows that the effect of seafloor seismic survey is positive or at least neutral for most cases considered.
Conclusion
To date, industry activity in the appraisal and development stages of deepwater fields has relied on 3D towed-streamer seismic as the source of the reservoir image. With many of these fields lying beneath complex structures, where large velocity contrasts exist, unsatisfactory seismic illumination has resulted in reservoir images that cannot be interpreted with a reasonable degree of confidence.
The advancement of seafloor seismic technology to water depths of 2,000 meters or more provides the opportunity for enhanced reservoir imaging, improved understanding of reservoir quality throughout the field, and perhaps the mapping of fluid distribution. The largest financial impact of having improved reservoir understanding will concern drilling and facilities investment:
- Wells will be drilled with higher success rates.
- Fewer wells will be needed to efficiently extract recoverable reserves because of a better understanding of the reservoir.
- Improved reserve estimates will allow for the appropriate facilities investment at the development stage.
- Major platform upgrades and drilling constraints, due to a limited number of slots, will be minimized.
- Secondary financial gains will come in the form of accelerated delivery of first oil.
Considered in this context, seafloor seismic is relatively inexpensive. Seafloor seismic technology can be viewed as an optimization and risk-reduction tool. With this tool, the industry will be able to make faster and better decisions concerning development scenarios.
The desire of industry to embrace and promote the use of deepwater seafloor seismic technology today remains an unfinished story. Will the industry continue to economize on its use of seismic, even on world-class multi-billion dollar assets? Alternatively, will it use a small fraction of the multi-billion dollar investment targeted for deepwater field developments to provide a better view of what is to be developed?
References
Muerdter, D., and Ratcliff, D., 2000; Subsalt illumination determined by raytrace modeling: a catalog of seismic amplitude distortions caused by various salt shapes: 70th Annual Internat. Mtg., Soc. Expl. Geophys., INT P1.9.
O'Connell, J., Kohli, M., and Amos, S., 1993, Bullwinkle: A unique 3D experiment: Geophysics, 58, no. 01.
Krail, P., 1994, Vertical cable as a subsalt imaging tool: The Leading Edge, 13, no. 08.
Barr, F., and Sanders, J., 1989, Attenuation of water-column reverberations using pressure and velocity detectors in a water-bottom cable: Annual Meeting Abstracts, Soc. Expl. Geophys.
Barr, F., 1997, Dual-sensor OBC technology: The Leading Edge, 16, no. 01.
Cafarelli, B., Madtson, E., Krail, P., Nolte, B., and Temple, B., 2000, 3D gas cloud imaging of the Donald Field with converted waves: 70th Annual Internat. Mtg., Soc. Expl. Geophys., MC 1.7.
MacLeod, M., Hanson, R., Bell, C., and McHugo, S., 1999, The Alba Field ocean bottom seismic survey: Impact on development: The Leading Edge, 18, no. 11.
Fromyr, F., and Randazzo, S., 2000, Using 4C data for predicting lithology and fluid type: World Oil, 221, no. 07, 93-97.
Zhu, F., Gibson, R., Watkins, J., and Yuh, S., 2000, Distinguishing fizz gas from commercial gas reservoirs using multicomponent seismic data: The Leading Edge, 19, no. 11, 1238-1245.
Li, X., 1997, Fractured reservoir delineation using multicomponent seismic data: Geophysical Prospecting.
Castagna, J., Bertagne, A., and Sparkman, G., 2000, Feasibility of Pre-Drill Detection of Sands Likely to Exhibit Shallow Water Flows Using Multi-Component Seismic Data: Proposal for a Joint Industry Project; Energy Research Clearing House.
