Commentary: review of global wind and solar patent data suggests proper course for renewable energy public policy
Andrew P. Morriss, Texas A&M University, and Andrew W. Torrance, University of Kansas
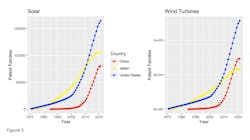
For at least the last decade, both the popular press and many academics have frequently portrayed the United States as a laggard in both on- and off-shore wind and solar technologies, praising China in particular for using industrial policy to drive adoption of both technologies onshore and offshore. For example, Forbes headlined last year that “China’s Wind Power Push Threatens US Strategic Interests” while a Reuters column announced this May that “China widens renewable energy supply lead with wind power push.” If we look only at the raw numbers, China is indeed fast catching up. Figure 1 illustrates this, showing cumulative number of solar photovoltaic and wind turbine patent families in the top three jurisdictions for these patent families in these technologies.
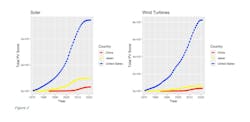
However, while China has increased the number of patents it has in both areas, and may indeed be building vast numbers of today’s renewable energy installations, when we dig deeper a different story emerges. Using PatentVector, a networked patent dataset that includes virtually all patents and patent applications in the world, we can take into account the quality of the intellectual property (as explained below). Adjusting for quality, the United States remains the innovation leader, as Figure 2 illustrates by showing the cumulative PVScores for each country.
Patent documents (patents and patent applications) are a valuable tool for tracking innovation, particularly where a technology is commercially valuable since that provides additional incentives to protect innovations. They are particularly useful because a patent application must cite the “prior art” in the relevant technology known to its applicant. Patent law incentivizes citing the relevant prior patents but no more: cite too few and your patent might not be enforceable; cite too many and you might unnecessarily narrow the scope of the patent claims covering your invention. The result is a complex and dense web of relationships among patent documents that can only be analyzed using network science.
PatentVector is a software system for analyzing patents that relies in part on patent data derived from PATSTAT, the most comprehensive worldwide patent database. This database is compiled and maintained by the European Patent Office, and contains essentially all patents and patent applications in the world in an electronic form. It applies an eigenvector centrality algorithm (from the same family as Google’s PageRank that determines the ranking of search results) both to group patents into related technology clusters (nested up to 14 levels deep) and to assign them a score (the “PV Score”) that measures the importance of patent documents in the network. This score has been validated against external measures of patent value and provides a previously unavailable means to compare the quality of patent documents. For ease of interpretation, the scores scaled directly, so that a patent document with a 1.0 score has the importance of the average patent in the database, one with a 2.0 is twice as important, and one with a 0.5 is half as important.
Using this data, we can analyze how patent documents in different nations’ patent systems compare across technologies. The key feature of both the technology clusters and scores is that they are determined by the network algorithm from the “bottom up” rather than being imposed by a human being from the “top down” (as patent office technology classifications, such as the Cooperative Patent Classification system, still are).
For an in-progress academic paper, my coauthors and I collected a set of the worldwide patents in these two energy technologies by gathering all patent documents in each of the technology clusters we identified as containing at least one patent having a claim containing either of the terms “wind turbine” or “solar photovoltaic.” After collapsing the results into patent families (i.e., if a patent application is filed earliest in one country and a related patent application is later filed in another country), we counted only the former, but gave it credit for the highest score in the family). This yielded 416,226 patent families for wind and 587,872 for solar.
The results of comparing patents in among the three leading jurisdictions for patents in these technology areas (China, Japan, and the United States) are striking. Table 1 shows descriptive statistics for wind and solar patent families for these three countries.
If we examine which country had the highest aggregate PV Score and highest share of patent families in the technology clusters containing our data, the United States dominates by that measure as well, as Table 2 shows.
What is striking about both of these ways of assessing where the technological lead rests is that both, using quite different measures of success, point in the same direction: the United States continues to lead in innovation by large measures.
What patent data suggest is that the popular narrative – which depends on raw counts of patents – misses the real story of innovation in these technologies. The magnitudes of the US lead, no matter which measure we use, is such that we are convinced it is not an artefact of a particular methodology. Moreover, national patent practices in all three jurisdictions (and many others) generally mean that patent protection for innovations described in patents is sought first at home, suggesting our results are not driven by a desire of foreign inventors to seek the benefits of the United States’ relatively robust protection of intellectual property. Since the data show that the United States is driving innovation in these renewable energy technologies, the goal should be to do more of what we are already doing, not attempt to imitate foreign strategies that the data show to be paper tigers.
In particular, the United States need not engage in protectionism or industrial policy, as the recent Inflation Reduction Act does, but instead to consider early stage research support, robust intellectual property protection, and rely upon our robust system of venture capital funding to select winning technologies. We don’t need to be focused on China in our rearview mirror, but on continuing to widen our lead by expanding areas of technology where the US dominates, such as the health innovation ecosystem that we’ve already established.
Andrew P. Morriss obtained his A.B. from Princeton, his J.D. and M.Pub.Aff. from the University of Texas at Austin, his Ph.D. (Economics) from M.I.T., and his M.Ed.Pysch. from Texas A&M University. He is a Professor at the Bush School of Government & Public Service and School of Law at Texas A&M University.
Andrew W. Torrance obtained his B.Sc. (honors Biology)) from Queen’s University at Kingston, Ontario, Canada, and both his A.M. (1994) and Ph.D. (1997) (Biology) from Harvard University, and his J.D. law degrees from Harvard Law School. He is the Paul E. Wilson Distinguished Professor of Law at the University of Kansas School of Law, and a Visiting Scientist at the MIT Sloan School of Management.


