High-resolution seismic process reveals complexities
Richard Salter
Nick Moldoveanu
Paul Hultzsch
Dianna Shelander
Diana Gillespie
WesternGeco
Delineating the Pemex Lankahuasa discovery in the GoM
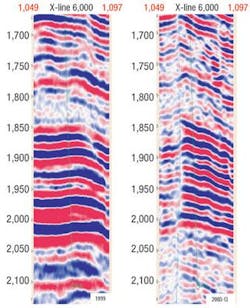
Amplitude anomalies seen in 1999 on conventional 3D seismic images of the Petroleos Mexicanos (Pemex) Lankahuasa discovery offshore Mexico, with a thickness resolution of only 98 ft (30 m), were initially used to place the vertical Lankahuasa-l (LH-1) discovery well, which cut multiple gas sands. However, a step-out (DL-1) drilled nearby into the same amplitude anomaly found noncommercial quantities of gas and introduced new structural and stratigraphic questions.
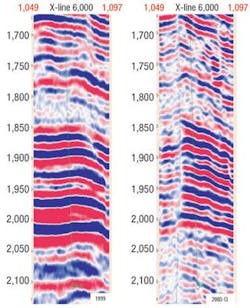
Pemex and WesternGeco joined forces in early 2003 to undertake a fully integrated seismic study of the Lankahuasa area leveraging WesternGeco’s Q-technology, which delivers seismic data with broader frequency bandwidth and higher resolution than traditional 3D technologies. The comprehensive study has revealed area details that are guiding further work in the Lankahuasa area.
The geologic setting is one of late extensional faulting of shallow marine sediments. In the area of study, the dip is down to the SE with a relatively flat-lying zone in the vicinity of the discovery well, LH-1. Gentle structural closure to the northwest forms the critical trap for gas-bearing Miocene sandstone reservoirs, down to 8,531 ft (2,600m), in the Lankahuasa field.
LH-1 was drilled in December 2001 based on amplitude anomalies evident in an 888 sq mi (2,300 sq km) 3D survey acquired in 1999. The DL-1 step-out was located 2.5 miles (4 km) down-dip of LH-1 and drilled at a deviation of approximately 40° into the same amplitude anomaly. It tested noncommercial quantities of gas, reducing reserve expectations and adding uncertainty about the petroleum system and reservoir type.
The initial Q-project objective was to explain and understand the different responses of the LH-1 and DL-1 wells in terms of productive capability. The second objective was to map reservoir property distributions through the swath between the two wells, as well as attempt to map the water saturation variations in the sand units between the wells.
The Q survey itself was acquired for comparison with a 1999 conventional 3D seismic survey to improve seismic amplitude fidelity and vertical resolution in order to accurately delineate previously identified prospects, and to better interpret and characterize the reservoir units.
Evaluation and design
The Lankahuasa seismic survey evaluation and design objectives set out to define the optimum acquisition parameters and processing sequence for the new survey. This was done by:
•Analyzing the existing 1999 seismic data and borehole information;
• Designing a Q-Marine proof of concept survey that would tie the LH-1 and DL-1 wells and assist in locating a second appraisal well; and
•Determining the processing sequence and seismic inversion rock property workflows.
Several conclusions were drawn from this analysis:
• There is strong attenuation of high seismic frequencies in the reservoir area;
•Frequency analysis of the 1999 seismic data showed that the maximum frequency attainable was 65 Hz (at 20 dB) and that the dominant frequency was around 27 Hz. The comparison of the 1999 seismic data with the reflectivity function derived from VSP data showed that a frequency bandwidth of 3-95 Hz would be required to properly map the reservoir sands;
•To recover the higher frequencies, a Q compensation filter would have to be applied. To prevent the boosting of high-frequency noise at the same time, a very good signal-to-noise ratio would be required;
•Recovery of the seismic signal at larger offset would be important for amplitude variation with offset (AVO) inversion studies, and the processing sequence should be tailored to remove the guided waves without affecting the amplitude relationship; and
• Petrophysical log analyses and a fluid substitution study indicated that it would be difficult to assess the reservoir gas saturation from seismic data.
Acquisition and processing
A 24.2 sq mi (62.7 sq km) survey was designed with an inline orientation in the local NW-SE dip direction. Q-Marine technology helped improve the seismic resolution and amplitude accuracy of the acquired data because of several system capabilities, including:
•Better preservation of the higher frequencies due to receiver perturbation corrections, calibrated marine source, and attenuation of marine noise through digital group forming (DGF);
• Improved signal-to-noise ratio; and
• Improved amplitude accuracy derived from perturbation corrections and improved noise attenuation.
Parameters of the Q-Marine survey design included the use of six 19,686-ft (6,000-m) streamers held at 328-ft (100-m) separation and towed at a depth of 19.7 ft (6 m). One Bolt air gun source would be located 16.4 ft (5 m) deep. A group interval of 41 ft (12.5 m, after DGF) and a source interval of 82 ft (25 m) were selected. The chosen bin size was 20.5 ft (6.25 m) inline and 82 ft (25 m) crossline.
Initial processing, including geometry merge, data editing and calibrated marine source (CMS) quality control, was performed onboard. The data were generally of excellent quality, with superb detail in the fault plane images, and very good resolution at all levels.
Based on the requirements for the new seismic data to have improved seismic resolution, signal-to-noise ratio and amplitude accuracy, a 17-step processing sequence was designed that ensured a true amplitude dataset.
Reservoir description
Petrophysical analysis in combination with fluid substitution modeling indicated that the Lankahuasa area would be a very challenging environment in which to provide a quantitative assessment of fluid saturation distribution. It was decided to provide a wider understanding of the reservoir behavior through an approach that married the direct calibration of the hybrid inversion volumes to reservoir properties with a qualitative description of the reservoir through attribute analysis.
To achieve these two primary goals, extensive work was done in the following areas:
• Sonic and density log editing and analysis to produce reliable acoustic impedance logs;
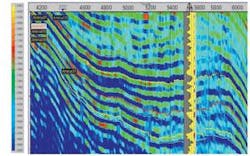
• Seismic interpretation, particularly to precisely delineate the three main Miocene sand units and related structure that would impact development plans;
•Hybrid seismic inversion, constrained by general seismic interpretation output, to derive P-impedance, S-impedance and Poisson’s ratio;
• Seismic attribute analysis including chaos, variance and instantaneous attributes to highlight structural and stratigraphic features and differences between the productive capacities of the two existing wells. This was carried out in parallel with the inversion process; and
• Petrophysical calculations culminating in reservoir property prediction and the ability to calibrate the seismic inversion volumes to properties such as lithology and porosity.
Details revealed
The Q-Reservoir Lankahuasa study has shown a degree of structural and stratigraphic complexity in the region around the Lankahuasa-1 well that was not evident in previous conventionally acquired seismic data.
Specifically, the high-resolution, broad-bandwidth seismic study resulted in:
•Unambiguous interpretation and maps of the top and base of individual reservoir sands;
• Improved amplitude and attribute anomaly maps for each sand;
• P-wave acoustic impedance that can be used as a porosity indicator in the reservoir interval;
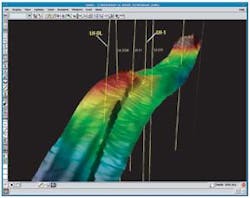
• An overall refined structural and stratigraphic understanding of the area that identified faults and fractures between the LH-1 and DL-1 wells that compartmentalize the gas production and may be drilling hazards;
• Identification of a region of lower P-wave amplitude in the reservoir interval between LH-1 and DL-1 than what is seen to the NW and SE in the small survey area, and conjecture that this “dim-out” zone is caused by gas percolating through a relatively densely fractured region in the vicinity of the wells;
• A gentle structural low of about 15 ms deep and 2.5 km wide, just ENE of LH-1. This may be a “sag” due to low velocities caused by higher gas saturations in the above-lying sediments;
• Through the zone of interest, the high-resolution seismic data exhibit off-lapping and down-lapping character, indicating possible limited lateral extent of individual sand units; and
• A fault with only about 10 ms of offset trends WNW-ESE between wells LH-1 and DL-1. The interpretation of this fault affected the location of a subsequent sidetrack.
Ongoing Lankahuasa work
Pemex signed on for a full-scale integrated acquisition, processing and reservoir description project for the Lankahuasa area after the success of the initial high-resolution seismic study described here. The extension survey covering a total of 138 sq mi (358 sq km) was acquired during Q3-Q4 2003.•
Acknowledgements
The authors thank PEP (Pemex) and WesternGeco for permission to publish the information herein, and the many professionals at both PEP and WesternGeco, and Schlumberger, who continues to contribute to the success of the Lankahuasa project. Some of the information found in this article was first presented at the OTC Conference, May 2004, and published as OTC 16397.
For more information contact Richard Salter, WesternGeco, [email protected], or www.slb.com.


