Seismic volume interpretation provides answers before mapping process

The business demand for detailed accurate mapping, in an environment of tremendous 3D (three-dimensional) data growth, continues to outpace current state-of-the-art interpretation work flows and technology. The solution to the interpretation problem is not to map faster for answers, but to obtain as many answers without mapping. Mapping, in general, is a very inefficient process.
The goal of volume interpretation work flows is to reveal and understand the "in situ" 3D model inherent within the 3D volume using transparency and then to illustrate that concept with maps. The millions of dollars invested in purchasing a 3D volume of seismic data include an imaged 3D seismic-geologic model. The most efficient path to investigate that model is to simply reveal it via transparency. The most inefficient method is to perform traverse-based digital interpretation.
Greater time benefits are realized when visualization skills increase, allowing for greater interpretation efficiency and accuracy. This commitment shifts the bulk of the interpretation effort from indirect traverse-based digitization to direct formulation of integrated (structural and stratigraphic) models.
The current mainstream 3D-interpretation process is traverse based. Its work flow in general can be traced back to the early 1900's when field geologists would survey traverses and stations for recording elevations, strike and dip, and rock descriptions. The data was then plotted, gridded, and contoured to produce structural and stratigraphic maps.
From the maps, the structural picture and a reservoir model was interpreted along with prospective areas. The same general work flow was followed for 2D (1930's) and 3D seismic (1980's). And, it is followed today with 4D seismic and a multitude of attribute volumes. The purpose of the effort is not the map, per se, but the answers produced:
- Where is it?
- What is it?
- How big is it?
Many preliminary, sketch, and experimental maps are generated along the interpretation process. They serve as temporary devices, answering questions and chasing alternative ideas that contribute to the overall knowledge and prospect package. Since mapping is a large time sink from which large financial investments are based, primary interpretation tools and work flows (specifically geophysical workstations) are designed around this process. Thus, the business is oriented around mapping.
This trend continues strongly today. It is taught by many universities, oil and gas companies, and software vendors. This deeply engrained work flow has created a hurdle for many experienced individuals and entire companies to make the paradigm shift from traverse-based to volume-based interpretation methods.
The fact that traverse methods in the past have discovered billions of bbl of new reserves, in itself makes it a very valuable process and skill. So, to make the transition from something successful to something new is even more challenging.
The enormous growth in 3D data volumes, which is a major problem, actually "contains" its own solution. Since we have a volume-oriented problem, then by simple logic, we should seek a volume-oriented solution. In a rapidly growing 3D-volume industry, traverse methods are becoming outdated. The following paragraphs introduce and describe the fundamentals of 3D seismic volume interpretation.
Fundamentals
Three-dimensional volume visualization is a method of seismic interpretation in which the geophysicist directly evaluates the seismic reflectivity of the subsurface in 3D space by applying various levels of transparency to the data. The technology and philosophy of 3D-volume visualization differ dramatically from conventional
line-based interpretation and includes new interpretation strategies and methodologies.
There are two basic types of visualization:
- Map-based (surface visualization)
- Volume-based (volume visualization).
Surface visualization results from mapping individual horizons and faults, and then re-interpreting them collectively in 3D space as a 3D model. Surface visualization is the logical end product of conventional mapping processes; therefore its position in the workflow follows surface mapping. Volume visualization is based on an entirely different attribute of the data - transparency. It represents a major paradigm shift in 3D seismic data interpretation.
Volume interpretation assumes that the seismic reflectivity of the subsurface is an "in situ" 3D model of the subsurface which, by its nature, consists of integrated structural, stratigraphic, and amplitude features in 3D space. The purpose of volume interpretation is to see the details of that "untouched" in situ model, and to formulate an accurate concept. Therefore, its position in the work flow should proceed illustrating or mapping that concept. In summary, the general interpretation workflow is as follows:
- Formulate the concept via volume interpretation
- Illustrate that concept via maps and surfaces
- Perform surface visualization to evaluate the surfaces in 3D space.
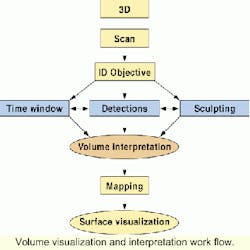
Volume visualization work flows must include interpretation strategies for a wide variety of problems. The volume interpretation workflow is designed to address flat intervals of strata, dipping units, and individual targets such as bright amplitudes.
The work flow begins by performing quality control measures specifically for visualization sensitivities, then obtaining over views of the data where regional and specific objectives are identified. Depending on the nature of the objective, a "focusing strategy" either time windowed, detection, or horizon-keyed (sculpting) is chosen to isolate the objective in preparation for the application of transparency.
In low-dipping strata, time windowed visualization is very effective for evaluating geology. Detection is useful for isolating or extracting a specific amplitude or regional event for detailed visualization and conversion into surfaces. This is particularly useful in evaluating stratigraphic features, mapping individual fault blocks, or creating regional surfaces.
Horizon-keyed focusing strategies are the most accurate method for evaluating an interval because they only include data within the zone of interest. This is ideal for the evaluation of dipping, complex stratigraphic units. After one of the focusing strategies is complete, transparency is systematically applied, utilizing the zone system (Leading EDGE, the fundamentals of 3D seismic volume visualization), to achieve the highest quality 3D image and interpretation from that data.
Structural visualization
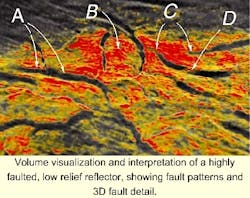
The primary benefit of structural volume visualization is its ability to quickly show subtle and complex fault patterns in 3D space. In conventional fault mapping procedures, the interpreter chooses which faults to map, which not to map, and how each fault is connected or not connected. Depending on the interpreter, skill level, and amount of time available, the quality and thoroughness of the task is highly variable.
It is the goal of structural volume visualization to quickly reveal all the faults accurately as recorded in the seismic record. Because both structural and stratigraphic volume inter-operation can be performed quickly, it is a good process for quality control of farm-ins and partner interpretations.
High reflectivity
Visualization of bright amplitudes is the most basic form of volume interpretation. Simple high and low-cut opacity filters can easily reveal a multitude of amplitudes in 3D space. Sub-volume detection can then be utilized to isolate specific amplitudes and convert them into surfaces. This simple process of pointing, detecting, and conversion to surfaces enables an interpreter to map a hundred plus amplitudes in a day.
The amplitudes can then be sorted with respect to depth, lease, drill status, and distance from platform reach. Key amplitudes can be quickly visualized for structural detail, internal stratigraphic features, impedance variations, and potential fluid contacts, without performing conventional mapping. Those that are selected for drilling are then fully mapped and worked with all other additional preparations for final prospect reviews.
In some organizations, prospect maps that only cover localized areas (postage stamp maps) are not sufficient for formal presentations. Interpreters are then required to include a regional framework, which often requires time-consuming regional mapping.
By utilizing volume interpretation and taking advantage of the large survey, the 3D regional can be incorporated into the presentation, by showing (versus mapping) how both structural and stratigraphic relationships pertain to a specific prospect. This work model can provide interpreters with more time to address critical prospect issues due to timesavings from regional mapping.
Decimation strategies
Often we find that the size of 3D volumes exceed hardware resources. Visualization strategies can be designed to address this problem. The strategies center on decimation, the geology, the nature of the objective, the available computer resources, and software performance.
For example, a data volume comprising 80 Gulf of Mexico blocks can be managed for general lead identification and regional geologic interpretation using a machine with 1 GB (gigabyte) of RAM. In areas of relatively flat regional geology (shelf or deepwater), the data may be divided into 1-2 second slabs. Decimating the inlines and cross lines (XY) by one (keeping only every other line in either direction) reduces the volume by 75%.
Decimating XY by seven (keeping only one in every seven lines in either direction) reduces the volume by 98%. The purpose of decimated volumes is primarily to identify areas of interest, and is not for detailed structural and stratigraphic interpretation.
Decimation tests have shown that a flat 90-acre amplitude remains easily seen after XY decimation by seven. Once specific areas are identified the volume can be re-loaded with prospect specific coordinates and without decimation. Since the decimated volume and its quick evaluation can be performed in computer memory, no addition disk space is needed.
So for example, a 32 GB 3D-volume (16 bit) is first reduced to 16 GB at 8 bit (most visualization technology uses 8 bit data). Then the 16 GB volume is further reduced to 640 MB using a modest XY decimation of four.
There is a tendency among interpreters to avoid any decimation. However with fast, interactive, volume reloading the interpreter can experiment to determine the optimal decimation parameters.
There is another perspective for viewing decimation. If the Gulf of Mexico was completely covered by one large 3D survey, a decimation of 40 would be equivalent to a 1 sq km closely spaced 2D survey with a 25-meter spacing. For identifying large (non-subsalt) leads, this would be sufficient. Therefore, single digit decimations should be used without hesitation.
Besides decimation, to further reduce the amount of data, the upper section of the 3D survey should not be included. This is especially true in deepwater areas. The lower portions, recorded for the sake of migration, should also be excluded. This can reduce a volume by 10-20% prior to decimation.
In regard to 3D surveys that are behind in delivery schedule, preliminary, low fold (for example 12-fold or 18-fold) volumes can be generated months prior to full-fold versions. They have been used in volume interpretation to understand regional geology and locate leads in surprisingly more detail than expected with decimation.
In this work model, the regional geology and leads can be identified and prioritized through visualization with little to no mapping, before full processed data is loaded into conventional geophysical workstations. The application of volume visualization on full-fold data, has in many cases shown structural and stratigraphic detail not seen using conventional interpretation methods due to its 3D nature.
Volume interpretation
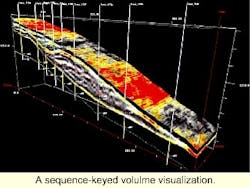
Intervals with significant dip require surfaces to isolate the objective from the surrounding data. Stratigraphic intervals cannot be accurately represented by a composite amplitude surface. However maps can be used as devices to isolate an interval, preserving its 3D architecture in 3D space. This method is most appropriate for volume interpretation since geology is three-dimensional.
Volume interpretation provides a method for geoscientists to quickly evaluate complex structural and stratigraphic and amplitudes in 3D space. The demand for fast detailed interpretation can be accomplished utilizing visualization strategies. The challenge of interpreting the growing number of large 3D volumes is now more manageable. As volume-interpretation skills increase, so will the efficiency of obtaining more answers without mapping, thus reducing the time for the 3D interpretation phase of the project.
Acknowledgement
The author recognizes Veritas DCG for the use of their data, and the support and guidance of Ozdogon Yilmaz of Paradigm Geophysical. The volume interpretation within this paper was performed using an SGI O2, with 256 MB RAM and a R5000 chip. VoxelGeo software by Paradigm Geophysical was used to visualize the 3D data.