Visualizing internal rock structures
New approach spans five scale-orders
Andreas Kayser
Rutger Gras
Andrew Curtis
Rachel Wood
Schlumberger
Observed petrophysical properties reflect the characteristics of a reservoir rock at a microscopic scale, thus close inspection of this microstructure is an indispensable part of core analysis. While conventional geological core analysis yields valuable data, it is essentially a 2D description – it only considers slices and does not directly and accurately address the 3D nature of the rock fabric and properties. There are apparent shortcomings to such methods, for example, when one observes seemingly isolated pores on any 2D slice. It usually remains unknown whether such pores are connected in the third dimension. Even using 3D measurements like mercury-porosimetry or nuclear magnetic resonance, cannot link the results to a specific feature and location inside the rock.
Computerized tomography (CT) is an non-destructive tool to determine rock properties in 3D. Originating in the medical field, it has proven successful in geological work for the examination of the inner structure of various rock types such as shales, sandstones, and coal; and the tool has seen wide use in the study of sedimentary structures.
These studies demonstrate the power of CT in geological research, as well as for classical petrography. The disadvantage of standard medical CT is that its resolution is too low for detailed geological research. Recent developments in the µCT field allow a much better resolution. Some practitioners claim that it is possible to achieve resolutions as low as 2 x 2 x 2 µm, depending on the size of the imaged object.
The application of virtual reality (VR) is playing an increasingly important role in many technical and scientific fields, including engineering, prototyping, architecture, and medicine. Application in the oil and gas industry to visualize large seismic datasets and potential drilling trajectories has been relatively recent.
null
null
But what is VR? M. Midttun gave the following definition: "A computer-generated artificial world in which users are immersed and where they can navigate and interact with objects in an intuitive and natural manner."
The advantages of using VR to visualize inner rock structures are:
- A large-screen visualization system, allowing simultaneous viewing by a large group
- A high degree of immersion, focusing the viewer's attention completely on the artificial world
- Stereo projection to generate depth in the viewer's perception
- Connection to the virtual world via head tracking, where the viewer can zoom in on or rotate data by stepping forward or sideways, as one would in the real world
- A 3D mouse-like device to navigate through the data
- The ability to share the 3D virtual world with remote sites across the globe, while needing only low bandwidth telephone connectivity.
Visualizing µCT data
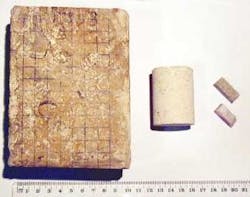
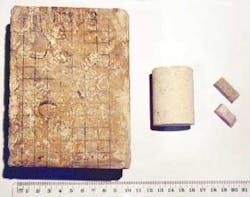
The samples used for this study range from full diameter core (4 in.) to subsamples that were carefully cut out of plugs for routine core analysis. The subsamples have a cubic shape with a volume of about 1 cu cm (~ 10 x 10 x 10 mm).
A micro-tomograph, operated by the Federal Institute for Materials Research and Testing (BAM) at the hard X-ray beamline at the electron storage ring Bessy II in Berlin, took the µCT measurements. Resolutions of 125 µm for the full core down to 10.8 µm for the subsamples show pore space and pore connections in high detail.
For visualization, software converts each pixel of a CT back to a 3D voxel. Each pixel can be referenced both by value and x, y, z location. By preserving the aspect ratio, the size of the voxels represent the original spacing of the voxel points, so that the final 3D volume can be related to the original 1 cc sample. As a result, a single value of the linear attenuation coefficient characterizes each voxel, which is represented by a grey level between 0 - 255.
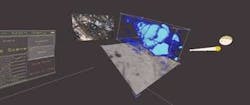
Inside Reality visualization software from Schlumberger Infor-mation Solutions was used for this project. The base for this application was a virtual reality interaction developed for collaborative decision-making by Norsk Hydro. The use of virtual reality software offers the opportunity to view features inside of rock samples in any direction.
null
Both slice and transparent volume views are possible, readily revealing the internal sedimentary and structural features of the rock. Provided that scanning has captured sufficient resolution, the views can easily separate grains from cement, matrix, and pore space.
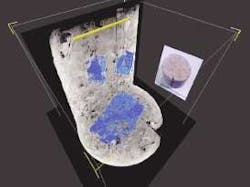
An example of such a high-resolution image with a voxel size of 10.8 µm is shown in the figure. The subvolume on the left shows only the quartz grains, and the volume in the center illustrates the distribution of carbonate cement. The pores and pore connections in the aeolian sandstone are visible in the subvolume on the right, and stereo viewing enables much improved perception of the potential fluid flow through these pores.
Voxel-based technology allows measurement of volume and geometry in pore space, cements, and grains. This provides important information in addition to, and complementary to, conventional core analysis. In many cases, the volume measurements are more precise than traditional 2D methods, such as point counting.
With the new method, it is possible to display any internal detail of a core or plug sample that shows a contrast in mineralogy, density, or porosity. This detail includes the display of grains or cements with a different mineralogical composition. Differentiation is also possible between the same grain types, e.g. carbonates, if their microporosity inside the various grains is different.
It is also possible to measure relative volumes of different grain types and cements and to track pore connections automatically through a software feature called voxel grower. This grower normally detects and isolates connected bodies and seismic horizons. Because the user can interact with the tracking settings, increasing or decreasing the size of pores by automatically expanding or contracting their boundaries, this is the first step towards constructing a virtual laboratory. The grower can also detect the isotropic or anisotropic nature of the pore space.
Looking at the pore geometry in immersive 3D gives the user an immediate feeling for the pore network and its properties. The user can measure pore size distribution can be measured in any direction and across length scales spanning five orders of magnitude (from microns to full-diameter core). Furthermore, it is possible to include data from conventional core analysis like thin section images or scanning electron microscope images for comparison with the tomography data. For most properties, this new method can increase both qualitative and quantitative understanding of the features measured, especially when combined with conventional analysis methods.
Experience demonstrates the potential of rock sample visualization as a complementary technique to conventional core analysis and CT scanning. The main qualitative benefits are: better definition of the 3D nature of the (micro-) structure and sedimentological fabric of the rock, and the ability to interrogate the rock volume in any direction and with transparency rendering. VR technology allows a team to view the data and achieve better integration, which fosters teamwork and enhances decision-making.
null
References
Coshell, L., McIver, R.G., and Chang, R.,1994: X-ray computed tomography of Australian soil shales: non-destructive visualization and density determination. Fuel, v. 73, pp. 1317-1321.
Duliu, O.G., 1999: Computer axial tomography in geosciences: an overview. Earth-Science Reviews, v. 48, pp. 265-281.
Hounsfield, G.N., 1972: A method and an apparatus for examination of a body by radiation such as X- or gamma radiation. British Patent No. 1,283,915. Great Britain.
Kayser, A., Kellner, A., Holzapfel, H.W., Van der Bilt, G., Warner, S. and Gras, R., 2003: 3D Visualization of a rock sample, Rotliegend sandstone, Southern Permian Basin: applications for core analysis and petrophysics. Proceedings of the 6th Petroleum Geology Conference of Northwest Europe, London.
Midttun, M., and Giertsen, C., 1998: Petroleum applications of virtual reality technology: Introducing a new paradigm. 68th Annual International Meeting: Society of Exploration Geophysics.
Midttun, M., Helland, R. and Finnstrom, E., 2000: Virtual reality – adding value to Exploration and prod-uction. The Leading Edge, May 2000, pp. 538-544.
Van Geet, M., Swennen, R., and Wevers, M., 2000: Quantitative analysis of reservoir rocks by microfocus X-ray computerized tomography. Sedimentary Geology, v. 132, pp. 25-36.
Verhelst, F., David, P., Fermont, W., Jegers, L., and Vervoort, A., 1996: Correlation of 3D-computerized tomographic scans and 2D-colour image analysis of Westphalian coal by means of multivariate statistics. International Journal of Coal Geology, v. 29, pp. 1-21.


