4D seismic provides quantitative data
Time-lapse seismic technique guides field management
Jaime A. Stein, Geotrace USA, Alexandre Bertrand, David Bannister, Geotrace UK
Applied widely in Europe and now gaining recognition in other oil and gas producing areas of the world, 4D (time-lapse) seismic technology has for several years been recognized for qualitative information.
That changes exist in the seismic plots of the same subsurface surveys taken at different times is usually fairly obvious, but it’s difficult to interpret the nature and magnitude of the differences. Although it may be possible to determine drainage patterns or fault permeability, most operators would like to know more specifically about fluid saturation, elastic impedances, and similar quantitative parameters to plan well and field operations. 4D seismic is relatively new, and improvements are continually being developed.
As shown in the three-province Troll Field, it is now possible to decide where to locate an infill well, change steam or water injection for EOR gains, start producing small deposits that might otherwise be overlooked, or in some other way improve the efficacy of hydrocarbon recovery.
However, certain factors must be considered and properly handled to make 4D analyses valid. A key factor is repeatability, conventionally expressed as “normalized RMS” (root-mean-square) magnitude. NRMS values above about 50-60% are considered too large to be of real value. In general, 30-40% is considered good, and lower values are excellent.
Although NRMS is not an absolute metric that allows a precise comparison of the repeatability of different fields, if measured in similar conditions, it can give an idea for such comparisons. A repeatability comparison between legacy data and 4D analysis from ten surveys obtained in the North Sea and GoM showed the range in NRMS values.
Five legacy surveys displayed poor repeatability with NRMS of 60% or higher, while the NRMS values for five 4D-specific surveys were below 40%. In two cases, NRMSvalues of less than 28% came from permanently installed receiver arrays. More recent experiments with both baseline and monitor surveys recorded in the last 4-5 years have achieved NRMS below 20%.
Because 4D technology depends on the differences between corresponding amplitudes in seismic surveys taken at different times, data accuracy is much more important than with conventional seismic. Acquisition-dependent processing may be needed to help reduce the effects of non-repeatability in legacy data.
Application of high-frequency imaging to optimize vertical resolution is becoming a standard procedure since it has proven highly effective in enhancing the accuracy and resolution of the 4D response. For marine surveys, seawater tides and temperatures, the effects of poor navigation information, and any variations in seismic shot and receiver consistency must all be considered.
Troll Field undrained deposits
Two seismic surveys, aimed primarily at helping define the reservoir, were acquired in 1989 and 1991 and later formed the base survey. Several 3D data sets have since been acquired and processed to serve as monitor surveys. Starting in 2000, a survey was acquired primarily to locate undrained volumes, determine locations for infill wells, and more closely define simulated GOC (gas-oil contact) movements. A survey of the Troll West oil and gas provinces was made in 2003, and a new shoot is currently being 4D processed over the entire area.
Production began on Troll in 1995. Data from 2000 and 2001 were merged to form the first monitor, the second formed from time-lapse processing of 2003 data with infill around the platforms removed from the base survey. The base survey suffered from irregular coverage and in shot-to-shot and channel-to-channel amplitude anomalies. These variations derive primarily because three separate surveys were completed several months apart using two different seismic vessels. Navigational data were also suspect.
Segregating into bins allows some degree of correction in the fold when individual bins are accumulated. However, 4D processing requires accounting for local variations in trace density where dimensions are smaller than the bin size. A two-dimension median filter can be applied after migration to remove this effect in conventional 3D processing. However, because amplitudes are affected, this technique distorts valid amplitude processing for time-lapse studies and should not be used as part of 4D processing.
To correct the poor repeatability in legacy data, an acquisition-dependent processing methodology (ADA) proprietary to Geotrace, was applied to mitigate detrimental effects previously outlined. Tidal effects were corrected with predicted-tide tables. Correction for residual effects used a model-based method.
An extension of conventional acquisition-dependant amplitude compensation accounted for irregular coverage by introducing a scaling term for each trace based on source and receiver positions for an acquired survey. Base and monitor surveys were both processed with Kirchhoff pre-stack time migration (PSTM) with ADA applied.
More than ADA
ADA, however, does not account for variations in shot-to-shot amplitude, nor individual receiver sensitivities. These can be corrected by using a running average of alpha-trimmed mean shot and channel amplitudes.
Frequency-dependant amplitude, time and phase variations were corrected by both global and trace-by-trace matching filters, which used a least-squares matching of co-located traces on pre-stack time-migrated data. It is possible to apply such trace-by-trace matching either before or after stacking.
The NRMS of the final matched data sets was 37%, a good enough repeatability to allow analysis with emphasis on quantitative definition of GOC movement after eight years of production.
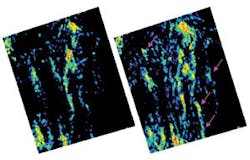
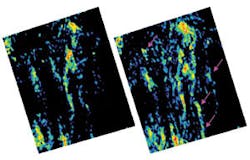
Although high repeatability is essential for 4D processing, another factor must be considered. Less distinct time-lapse effects can be defined more clearly by increasing survey bandwidth (including more high-frequency information for better vertical resolution). This is especially important for continuous monitoring and for more complex reservoirs. Fig. 1 shows a time-lapse RMS amplitude map with and without high-frequency imaging applied.
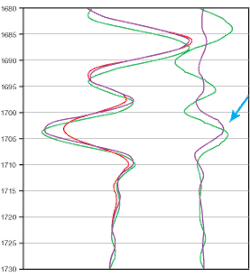
The 4D difference is sensitive to spurious time shifts which degrade repeatability. A new approach overcomes the problem while preserving higher frequencies. It splits time-shift-induced from amplitude-induced 4D signals by morphing the monitor onto baseline data. Pulse-shape recognition criteria allow every single peak and trough from the monitor data set to be aligned with its baseline counterpart. Cross-correlation was not employed because of its tendency to be inaccurate when time shifts vary rapidly or even change sign. Differences with the new method - called “4D friendly” - provides more accurate measure of amplitude changes free from corruption by velocity or noise-induced travel-time differences. Fig. 2 shows the effects of 4D friendly differencing.
The varying time shift of about 2 ms at 1,687 ms drops to zero at 1,710 but shows significant difference at 1,703. The straight difference (green-right) highlights a similar 4D signal at 1,680 to 1,710, making recognition difficult. After the monitor has been morphed, only the amplitude difference at 1,703 remains (blue-right).
GOC movement can be estimated by monitoring, through time shifts between the baseline and monitor surveys, thickness changes for gas-bearing sand and/or underlying oil-bearing sand. An equation can be written, which requires knowing only a constant derived from prestack data, in terms of only thickness change.
Another method analyzes the time shift character. Analysis or modeling can show that time shifts related to interface movement occur primarily at the time of interface. Interface movement tends to thin or thicken the layer immediately above the interface which is compensated by corresponding thickening or thinning of the one layer below.
Neural networks, with their ability to be trained (”learn” from results of running a program), can also quantify GOC movement. They are often used to create property volumes from seismic data and well log calibration. Time-lapse logs from vertical wells calibrate 4D data to estimate change of gas saturation.
Typically, many attributes are selected to be processed by neural networks. For the Troll Field, movement had been quantified from time shift analysis. As noted above, thickness change resulting from GOC movement relates to velocity change and time shifts. Three seismic properties were selected to train the neural networks to determine gas-saturation change:
• changes of acoustic impedance, which relates to velocity and density (gas saturation)
• time-thickness change data related to velocity and thickness change
• acoustic impedance, which indirectly relates to porosity and where saturation is more likely to vary.
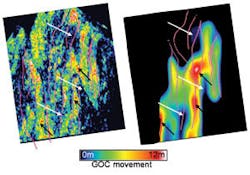
The volume of gas-saturation change and total GOC movement was then determined by applying the trained neural network to the entire sets of data. Fig. 3 maps GOC movement.
Note in this figure that movement ranges from zero to about 12 m. Maximum-movement areas correlate with locations of well tracks resulting from drawdown. Such maximum movement may also indicate gas breakthrough as it almost matches the entire extent of the original oil-column thickness.
When GOC movement calculated by the simulator is compared to time-lapse seismic analysis, similarities and discrepancies are revealed. Most high and low zones are common. However the difference in resolution (12.5 m for seismic versus 250 m for the reservoir model) is reflected in more detail for seismic. Reservoir engineers can use these differences to refine the reservoir model since drainage patterns indicate permeability distribution. Production engineers can locate undrained areas which may represent millions of dollars when produced.
4D analyses to compare legacy/baseline data with another survey taken at a different time can be simpler than often supposed. However, close attention must be paid to repeatability and differences in data-acquisition methods and times. A growing practice is to leave seismic arrays in place where practical so monitor surveys can be taken with minimum changes from previous runs.
Troll 4D datasets allow quantitative analysis of GOC movement. HFITM and morphing allow traveltime and amplitude differences between baseline and monitor surveys to be separated and extracted. Neural networks have been successfully used to define GOC movement. Enhanced resolution yielded useful reservoir management information. More efficient production has been allowed, and isolated zones which otherwise might have gone undetected can now be economically produced.
The Troll field and other examples clearly indicate that 4D seismic, when appropriately used, can be of great value.•
Acknowledgments
The authors thank the Troll partners (Petoro, Statoil, Shell, Total, ConocoPhillips, and Hydro) and, in particular, Sture Leiknes and Hans-Egil Ro from Hydro for the permission to publish this work.
Figure 3. Left: GOC movement derived from seismic analysis. Right: Results of reservoir simulation after smoothing. Black arrows show zones of large movement common to seismic and simulation derived maps; white arrows show zones of low movement.


