Decommissioning activity on the decline in the Gulf of Mexico
Some 1,900 structures remain in shallow water
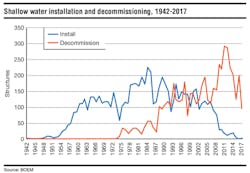
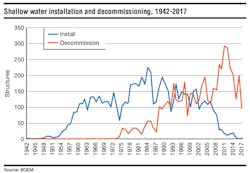
Over the past decade, there has been a significant reduction in the number of shallow-water structures installed in the Gulf of Mexico (GoM), and record levels of decommissioning activity has taken place.
More than 40% of all shallow water decommissioning activity in the GoM was performed from 2007-2016, a total of 2,084 structures or on average 208 structures per year, compared to 285 new installations or about 28 structures per year over the same period.
In the sixth and final part of this review on shallow water structures in the GoM, installation and decommissioning data and trends for the region are highlighted.
2016-2017 activity
In 2016, there were 197 structures decommissioned (70 caissons and well protectors, 127 fixed platforms) and 697 well abandonments (585 permanent abandonments, 112 temporary abandonments) in water depth less than 400 ft (122 m). No structures were installed in 2016.
In 2017, 108 shallow-water structures were decommissioned (40 caissons and well protectors, 68 fixed platforms) and 518 wells abandoned (336 permanent abandonments, 182 temporary abandonments). One structure was installed in 2017.
Trends
Decommissioning activity fluctuates year-to-year and from 2007-2016 between 127 and 290 structures were decommissioned annually. Activity levels exceeded 200 removals per year from 2009-2014, peaking in 2011 at 290 structures decommissioned.
High level of decommissioning activity in recent years are due in large part to the aging infrastructure and maturity of producing properties in the region coupled with low oil and gas prices. Clean-up activity from the 2005 and 2008 hurricane seasons has only contributed incrementally to decommissioning activity and is now nearly complete.
NTL 2010-G05 idle iron guidelines have also played a role in decommissioning activity and require operators to decommission structures that no longer serve a useful purpose within five years of no longer serving a useful purpose, unless special circumstances apply, or a temporary exemption is granted.
Installation activity has fallen so dramatically so fast due in large part to the maturity of shelf production and the lack of new discoveries in the region. The shelf is gas prone and small offshore gas fields cannot compete with cheaper shale plays when gas prices are in the $4/Mcf range.
Oil wells on the shelf continue to produce and incremental production continues to be added at existing developments, but new fields have been difficult to find, and large finds are unlikely at this stage of maturity.
Side track opportunities at existing fields do not involve high capital spending but still require capital and are risky endeavors with limited upside, attractive mostly to niche players and those with large portfolios of legacy assets that can balance and manage the risk involved with investment and operations.
Cumulative activity
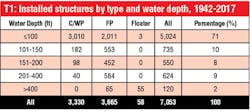
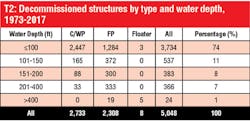
A total of 7,053 structures have been installed in the GoM and 5,048 structures have been removed through 2017, leaving an active inventory of 2,005 structures. Ninety-seven structures of the active inventory are in deepwater, 51 floaters and 46 fixed platforms.
In water depth >400 ft, 65 fixed platforms and 55 floaters have been installed through 2017, and 19 fixed platforms and five floaters have been decommissioned.
Decommissioning activity correlates broadly with the geographic distribution of installations. The more structures installed in a region the more structures will be decommissioned relative to other regions and these trends are readily apparent in the cumulative statistics.
The percentage of installed and decommissioned structures by water depth are broadly similar and reflect this correspondence. Regions with older structures have a slightly higher overall decommissioning rate as a percentage of total activity compared to regions with structures of more recent vintage.
Eighty-five percent of structure decommissioning in the GoM has occurred in water depth <150 ft (46 m).
Installation by decade
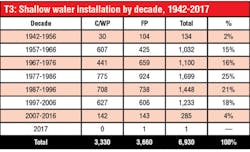
There has been a dramatic decline in the number of shallow water structures installed in recent years. From 2007-2016, a total of 285 structures were installed, on average about 29 structures per year.
Installation activity of caissons, well protectors and fixed platforms show similar trends across time, peaking in the 1977-1986 period when about one-quarter of all installations occurred at an average rate of 170 structures/year, declining to 145 structures/yr from 1987-1996, and 123 structures/yr from 1997-2006.
Shelf installations are not expected to add materially to structure inventories in the near term unless there is a dramatic change in current knowledge and conditions in the region.
Decommissioning by decade
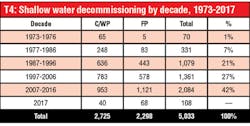
The first structure decommissioned in the GoM was in 1973, but it was not until the mid-1980s that activity levels began to pick up.
From 1987-1996, 108 structures per year were decommissioned on average, increasing to 136 structures/yr from 1997-2006, and nearly doubling to 208 structures/yr from 2007-2016.
More than 40% of all decommissioning activity to date has occurred over the past decade. Historically, caissons and well protectors were removed in greater numbers than fixed platforms, but over the last 10 years more fixed platforms have been removed than simple structures, a trend that is likely to continue.
Caissons/well protector inventories are depleting at a faster rate than fixed platforms and currently represent a little less than one-third of the active inventory circa 2017. •
