WELL CONTROL & TESTING: Walking the tightrope between pore pressure and fracture gradient
Drilling in deepwater has forced a more complete understanding of, and apprec-iation for, pore pressures and fracture gradients. Shallow water flow (SWF) sands perhaps exemplify the most extreme example of how narrow the window between pore pressures and fracture gradients can be.
As stated by Mark Alberty of BP at the 2000 Offshore Technology Conference (OTC #11971), SWF sands are overpressured, unconsolidated sands encountered before pressure control is in place on the wellhead assembly. They may flow into the wellbore if their pore pressures are not balanced by the mud weights.
However, if the mud weights are too highly over-balanced, the sands may fracture, resulting in lost returns and loss of well control. The margins for wellbore pressures may be less than +100 psi for shallow depths below the mudline in deepwater wells.
The Kestrel well was drilled at a water depth of 2,795 ft in Mississippi Canyon Block 632, an area of well-documented SWF. Data from nearby wells were incorporated in designing the casing and mud weight program. Essential to the design were predictions of the pore pressures and lithology.
Efficient well design required a pore pressure prediction of not only the SWF section, but the deeper over-pressured sections as well. Accurate predictions required the input of a pore pressure analyst, geophysicists, seismic interpreters, operations geologists, and drilling engineers.
Well planning
The Kestrel well was designed with information from a number of wells, but the most important information came from the Mississippi Canyon (MC) 718 No. 1 well. Planning for SWF in this well was presented in OTC #7971 in 1996. The MC718 No. 1 well is significant in several aspects. The well was located, in part, to avoid much of the SWF section, which was identified throughout the area on 3D seismic data and locally interpreted on high-resolution 2D data.
The well also provided time-depth information and a starting point for stratigraphic correlation. Drilling reports from the well indicated that the mud weight was increased incrementally to control pressures and accurate interpretation of the formation pore pressures encountered was possible. Perhaps most significantly, the casing points were often in sandy sections so that the leak-off test data were available for calibration of the sand fracture gradients.
The choices for the Kestrel well site did not allow for avoidance of much of the SWF section as was done in the MC718 No. 1 well. A critical element required to estimate pore pressures in the SWF zone at Kestrel was an accurate prediction of the top of the flow unit.
Seismic velocities were examined to determine the likelihood of pressure variations between the wells. No velocity variations of significance were observed. This led to the conclusion that the shale pore pressures and time-depth function from the well could be used reliably at Kestrel.
Because of water depth variation, a velocity function for time-depth conversion was hung from the water bottom. In the case of the Kestrel well, the seismic data used were from three surveys acquired at different times. Water velocity and subtle acquisition variations made predicting the water depth one of the larger uncertainties.
Finding the balance
Overburden stresses for the Kestrel well were obtained by adjusting the MC718 No. 1 overburden stress curve for the water depth difference. The MC718 No. 1 sonic log, shifted to the water depth at Kestrel, was used to estimate shale pore pressures. Pore pressures in the target sand at Kestrel were extrapolated along fluid gradients from MC718 No. 1 pressure measurements.
Pore pressures in the SWF zone and a second, shallow sand were extrapolated along a water gradient from the estimated intersection point between each sand's pore pressure profile and the shale pore pressure curve (the "centroid" for each sand). Sand and shale fracture gradients were computed using stress ratios derived from MC718 No. 1 leak-off tests.
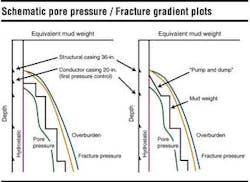
Mud weights must be higher than the pore pressure gradients so that the formation fluids do not flow into the well on the one hand, while they must be less than the formation fracture gradients to avoid fracturing the formation and losing returns on the other hand. Casing programs are designed to protect the wellbore from formation pore fluid influx at depth and to protect the shallower formations from hydraulic fracturing at shallower depths.
In deepwater, the margin between the pore pressures and the fracture gradients can be very narrow, requiring several casing points in the shallow portion of the well bore to "walk the tight rope" between these gradients.
Riserless drilling
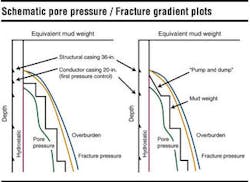
An alternative to the traditional drilling approach is riserless drilling. Dubbed somewhat facetiously as "pump and dump," this is a logical approach to drilling in deepwater. Since pore pressure, overburden stress, and fracture gradients all converge at the seafloor, the basic idea is simply to allow the pressures due to the drilling fluids to build up from the same gradient reference point as these other gradients. By allowing the drilling fluids to vent at or near the seafloor, the pressure profile due to the mud can follow a profile sub-parallel to the fracture gradients.
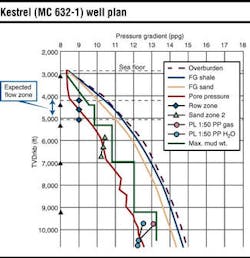
The pre-drill pressure prediction and casing plan for the Kestrel well are recognizable from standard pressure prediction plots. However, while most pressure prediction plots are constructed from 1D vertical considerations only, this one accounts for lateral transfer effects. The transfer of pressure to the Kestrel location within the sands encountered in the MC718 No. 1 well is illustrated by the curves crosscutting the main pore pressure.
The 20 in. casing point (where pressure control could be installed) had been "pushed" into the predicted shallow water flow zone. A more conservative approach would have been to set casing above this zone. However, this would have required another casing string to reach projected total depth for the well. As a result, this somewhat more aggressive plan was made, but with the integrity of the well bore and drilling safety in mind.
Drilling the well
Pre-drill meetings included discussions of SWF potential and the key issues for casing points. The location of the well had been chosen, based on stratigraphic interpretation, to avoid some of the sands expected in the shallow water flow zone, but most of these sands could not be avoided.
Stratigraphic interpretation indicated that the top of the flow zone would be encountered at 4,072 ft subsea and the first sand within the unit would be encountered at 4,239 ft. If the pore pressure of this sand could be controlled, then the casing point could be pushed to at least 4,400 ft and a casing string could be saved to reach the desired total depth. The riserless drilling program was designed to do just this.
A well planning team (WPT) to plan and drill was formed. The team that planned the Kestrel well was kept essentially intact for the drilling of the well and provided continuity between the design and execution of the well.
Once the well was spudded, daily meetings to monitor and discuss the status of the well were held with the entire WPT. The predicted formation depths and desired casing points were updated with the accurate water depth. The LWD (logging while drilling) data was compared carefully to the predicted lithology and the observed seismic response. Any possible adjustments to the well design based on the well data were thoroughly considered.
The criterion for setting the 20-in. casing and establishing pressure control was simply given to the drillers as "the first good shale below 4,400 ft." With no riser and no returns, LWD resistivity and gamma ray were monitored to determine a suitable casing point.
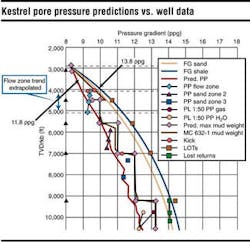
Drilling began with 11.8 ppg calcium chloride weighted mud after setting the 36-in. conductor. LWD and PWD (pressure while drilling) tools were used to monitor downhole pressure and lithology. Drilling went smoothly to the 20-in. casing point at 4,470 ft. A small, "whispy" flow was detected by the remotely operated vehicle at the wellhead, when circulation was stopped. To control the flow, the mud weight was increased to 12.6 ppg to stop the flow, and then to 13.8 ppg for casing operations.
A possible reason for the flow became evident when the LWD data was examined. While the top of the flow zone and the first good sand in this zone were accurately predicted, no flow was expected from the top portion of the flow zone. The top of the flow zone, while not a sand, is certainly not shale. Our interpretation is that the flow originated from this somewhat permeable, silty section near the top of the flow zone.
If the pressures at this level are computed as they were for the sand below it, we see the need for the increased mud weight over that predicted. This increased pressure due to the shallower encounter of this permeable section is only 30 psi. It must be noted that, while the 0.8 ppg increase in mud weight that controlled the flow seems reasonably large, this represents less than 70 psi difference in the downhole pressure at the top of the flow zone.
Once casing was set and a riser installed, the mud was changed out to synthetic mud. PWD was continued because of the continued narrow margin between the pore pressures and the fracture gradient, which was now confirmed by the leak-off test at the 20-in. casing shoe.
The well was drilled encountering the predicted lithologies near the predicted depths. A minor lost returns incident was encountered below 9,200 ft. The losses occurred when the recorded equivalent circulating density (ECD) exceeded the predicted sand fracture gradient.
The loss most likely occurred at the 9,770 ft sand below the 9 5/8-in. casing point. The PWD data indicates that downhole pressure increases were due to excessive ECD, probably due to cuttings in the mud and surge during running into the hole. Slowing down the circulation ended the lost returns problem and total depth was reached without further incident.
Conclusion
The Kestrel well was not drilled in excessively deep water by current standards. However, it is a good case to show the principles used to design and drill deepwater wells. For SWF, it is the sand pore pressure and fracture gradient that is most important to predict. Sand pressure prediction via up-dip transfer was the key to the minimum mud weights.
Riserless drilling was used to maintain the wellbore pressures between the formation pore pressures and the fracture gradients in the very narrow margins in the shallow portion of the hole. PWD and LWD were essential tools for monitoring the pressures and lithology. In order to plan and execute the Kestrel well, input from a wide variety of disciplines had to come together to properly interpret the data which ranged from seismic reflectivity and velocity data to well log data and pressure measurements.
Although two minor events occurred during the drilling of the Kestrel well, the predicted pressures were very accurate. Key to the well design was knowledge of pressures and lithology in a nearby well, plus accurate stratigraphic interpretation and time-depth prediction to carry this knowledge to the Kestrel location.
Planning and execution of the Kestrel well required close cooperation of geologists, geophysicists, drilling engineers, and a pressures specialist. Without a team to contribute from a variety of disciplines, the well would have been, at best, more expensive, and at worst, lost. With the team working together, both in planning and drilling, some subtle effects were diagnosed and controlled, and the Kestrel well was drilled safely and under budget.
Acknowledgement
BHP Petroleum, 2001 Offshore Technology Conference, and the Society of Exploration Geophysicists granted permission to publish this paper and we thank the people who reviewed it. The well planning team of BHP and outside contractors provided close cooperation and excellent work during planning and drilling.
References
Alberty, W.: "Shallow Water Flows: A Problem Solved or a Problem Emerging," OTC #11971, 2000 Offshore Technology Conference.
Byrd, T., Schneider, J., Reynolds, D., Alberty, M., Hafle, M. : "Identification of 'Flowing Water Sand' Drilling Hazards in the Deepwater Gulf of Mexico," OTC #7971, 1996 Offshore Technology Conference.
Editor's Note: This is an updated version of the OTC #13104, presented at OTC (April 30-May 3,2001) in Houston, Texas.


