Benchmarking petroleum asset developments requires individual and system focus
Daniel L. Needham and Edward W. Merrow
Independent Project Analysis Inc.
Upstream benchmarking needs to be understood in two contexts: bench-marking of the individual asset development project and benchmarking of the system that a company uses to develop upstream assets.
Major upstream projects are technologically and organizationally complex. Within the operating company, geoscientists, reservoir engineers, drilling engineers, and facilities engineers must work cooperatively to develop an asset. Scores of contractors and subcontractors, host governments, and partners must all be coordinated and aligned to produce a successful venture. In this context, benchmarking is both more difficult and more important. It is more important because benchmarking can be instrumental in producing the necessary alignment and coordination. It is more difficult because different players are looking for different benchmarks.
In upstream developments, benchmarking is used in several different ways, each of which has a somewhat different set of consumers.
Benchmarking can be used to develop and maintain functional excellence. For example, benchmarking of well construction results with measures such as cost per foot drilled or days per 10,000 ft drilled can be used to roughly assess drilling efficiency and the learning curve. Establishing industry cost and schedule norms for facilities helps project teams set competitive targets and helps keep contractors' estimates competitive.
A more powerful use of benchmarking is to establish the relationships between getting the desired results, be it for reservoir engineering, well construction, or facilities, and the practices that create those results. In this article, the terms practices and key leading indicators are used almost interchangeably. Key leading indicators are the measures of best practices. Over the past 15 years, quanti- tative benchmarking has established with hard statistical facts the practices that engender more effective functions and more effective overall asset development.
A still more leveraging use of benchmarking results is in the overall control and improvement of the asset development process. This use of benchmarking, which is practiced by a number of upstream companies, involves the constant monitoring of project system performance with benchmarking metrics, understanding of competitive position on a substantial number of metrics, and then improving the key drivers that will result in improved future performance.
Finally, the most powerful use of quantitative benchmarking is to help frame better business decisions at a number of points in the asset development process. These include the decision to develop or bid for a concession, the selection of development scope, and the timing of key activities.
What to benchmark
Most benchmarking activities focus on a particular measure of an outcome, e.g., cost per foot drilled in wells construction or cost per ton of a platform substructure. IPA's approach to benchmarking is quite different. We have found that benchmarking can be a powerful quantitative tool to link key results with the practices and approaches that drive those results. When we can reliably link a desired result with a particular practice through statistical analysis, it provides new meaning to the term "best practice."
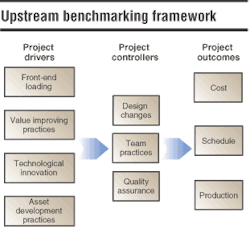
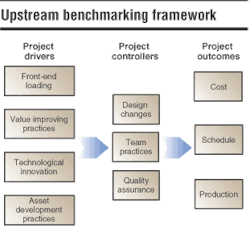
The benchmarking framework has been developed through 12 years of data collection and analysis of petroleum asset developments. The framework is based on the analysis of detailed data on more than 800 field developments in all parts of the world. The project outcomes – cost competitiveness, cycle time competitiveness, and attainment vs. planned production levels – are, taken together, a very good measure of business success. Each of the project drivers and controllers, illustrated above, were selected based on statistical analyses of the relationship between the factor and the project success measures.
Understanding project outcomes
Each of the boxes in the "Up-stream benchmarking framework" figure encompasses a set of metrics describing performance or drivers of performance. We will illustrate this with the cost measures. In the IPA system, cost is evaluated at three levels. At the highest level, we examine capital cost/boe, using the P50 reserve, controlling only for reserve size and, in the case of offshore developments, water depth. This metric is quite useful for portfolio development and for concept selection.
At the second level are benchmarks for concept costs, e.g., steel-piled jackets, TLPs, FPSs, FPSOs, subsea with tie-backs, plus export pipeline costs. Each of the major concepts costs is benchmarked based on technical characteristics (topsides capacities and configurations) and circumstances (water depth) using a statistical model based on actual achieved performance of past developments. Also at this second level are models for development drilling and completions costs. These cost metrics serve the following purposes:
- When two concepts are still being considered, our clients use the metrics to help decide which concept to select for a particular field development
- Companies routinely use the metrics during front-end loading to ensure that they are setting competitive targets for their projects in both facilities and drilling
- Companies use the metrics ex post to establish how well they have performed.
At the third and lowest level are cost metrics such as cost/ton and cost/ft drilled. These measures are used to help validate cost estimates and enhance effectiveness at the functional level.
Understanding project drivers
Contrary to widely held belief, the most important benchmarking metrics are not those, such as cost and schedule, which are used to assess a project looking back. Rather, measures of the key leading indicators of asset development success such as front-end loading, use of the subsurface and facilities value-improving practices, and best asset development practices are most important. These measures can help the asset development manager, the project manager, and the leadership of a company's asset development system make better decisions. Three examples illustrate this.
Aggressive field appraisal
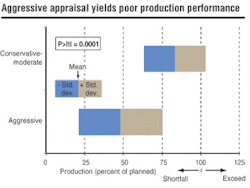
As a first example of tying leading indicators and the practices they measure to results concerns asset appraisal strategy, which is an element of asset development practices. IPA classifies appraisal strategies into three groups: aggressive, moderate, and conservative. The classifications are based on how fully the reservoir properties are defined, the level of definition of the fluid properties, and the portion of the field that was tested in the appraisal drilling program.
Over the past decade, aggressive appraisals have become much more common, especially in deepwater where the appraisal drilling costs are high and minimum cycle time is sought to meet production promises. Although asset developers know (or should know) intuitively that aggressive appraisal carries added risk, benchmarking establishes the extent and manifestation of the risk. The greatest area of risk for aggressive appraisal approaches is poor production.
Average first year production is less than 50% of planned when aggressive appraisal was used but over 80% when moderate or conservative appraisal was employed. The statistical strength of the relationship is convincing at less than one change in 10,000. This information is useful to the asset development manager trying to decide whether to pursue an aggressive approach. The expected gain of more than 30% of planned production in the first year may well pay for several additional appraisal wells with ample cash flow to spare.
Front-end definition reduces cost
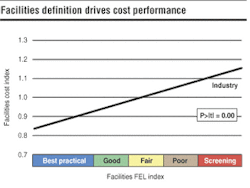
The second example shows the importance of front-end loading (FEL), or project definition, to meeting cost objectives. Front-end loading is the work process through which an asset is defined in preparation for execution. There are three FEL indices for upstream developments: reservoir FEL, drilling FEL, and facilities FEL. The combination of these indices is the asset FEL Index. The "Facilities definition drives cost performance" figure shows the relationship between the facilities FEL index and the relative cost of facilities. The numerical rating has been translated into categories for purposes of explanation. The FEL index measures the preparedness of the facilities to enter execution. As the figure shows, the best-defined projects had facilities costs that averaged about 15% less than industry while poorly defined projects cost 15% more. This is a swing of 30%, which, given the size of most companies spending on facilities, is a huge amount of annual cost.
Team integration speeds execution
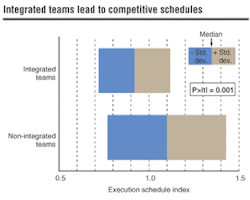
As a third and final example, let's turn our attention to one of the team practices measured by the benchmarking framework, team integration. A team is considered integrated if, during front-end loading, all of the functions needed to define the project are represented on the project team and are empowered to make decisions for their functions.
Integrating the asset teams leads to much more competitive execution schedules, in which execution time is measured from the start of detailed engineering of facilities until first oil. There is nearly a 20% difference in execution times between the integrated and non-integrated team projects. Because this is late in the asset development cycle, significant gains in net present value are associated with shorter execution times.
In the three examples above, we have sought to demonstrate the power of quantitative benchmarking to guide better decisions and better management of asset development. Although the connections between drivers (appraisal strategy, FEL, and team integration) and results (better producibility, lower costs, and faster schedules, respectively) may be intuitively obvious to many upstream project professionals, the ability to demonstrate and quantify the relationships helps ensure that intuition will not be ignored. Furthermore, what is intuitive to a facilities engineer, a geoscientist, a drilling engineer, or a business person may be a complete surprise to the other three functions.
Improved profits
The only sound reason to benchmark upstream projects and upstream project systems is to improve the effectiveness and ultimately profitability of asset development. Benchmarking should be considered an integral part of any continuous improvement effort at the system level and is an effective way of ensuring competitiveness at the level of the individual project.
Quantitative competitive benchmarking should be used at many points in the overall asset development cycle.
Early in the cycle, benchmarking can help a company decide whether to proceed with development at all. A fairly large number of developments proceed through concept development and definition before it occurs to someone that the capex/bbl of recoverable reserves will be too high to justify continued work. In some cases, of course, the momentum of the project permits development to proceed even then. In most cases, a solid fix on the capex/boe could have been achieved via benchmarking early on.
Benchmarking can help address issues of basic development strategy including appraisal philosophy and concept selection.
Benchmarking can be used, in combination with good practices, to set aggressive but attainable cost, schedule, and production targets. Benchmarking can also protect against setting unattainable targets, which are frequently associated with disaster projects.
Benchmarking results can help the company and the individual project manager understand the practices that should be followed to achieve best practical results.
Finally, benchmarking can be used to put the results achieved in proper perspective and generate meaningful lessons learned.
Authors
Daniel L. Needham, manager of the Upstream E&P business area at Independent Project Analysis, is a geoscientist who spent 10 years with Arco International before joining IPA. His area of special expertise at IPA is asset development strategies. Needham can be contacted at [email protected].
Edward W. Merrow is the president of IPA. He has written extensively on the management of capital project systems through benchmarking and has guided the development of quantitative benchmarking at IPA for the past 15 years. Prior to founding IPA, he was director of the Energy Program and Process Industries Program at the Rand Corp. Merrow can be contacted at [email protected].
