Subsea monitoring data improves riser-wellhead system design and operation
Findings from deployments should enable better fatigue loading predictions
Scot McNeill
Daniel Kluk
Kenneth Bhalla
Stress Engineering Services, Inc.
The term “monitoring” can elicit thoughts of arrays of sensors, circuitously routed wiring and convoluted readings, temporarily installed to support a critical operation. A seasoned engineer may be conditioned to recall the orphaned machinery of a well-intended Asset Integrity Management (AIM) system: long-forsaken instrumentation, dysfunctional data historians, and Human Machine Interfaces (HMIs) that are clearly more machine than human.
In the first case, data is used for the sole purpose of supporting operations, without retention or reuse. In the second case, actionable insight is not effectively extracted from the data, leading to disuse of the system. In both cases, learnings are not effectively harvested and fed-back into the design cycle. This trend, however, is quickly being reversed in the oil and gas industry.
With the growing percentage of industrial components and processes being monitored and the enduring drive to increase efficiency, the appetite for unlocking the value concealed within unnumbered petabytes of raw data is on the rise.
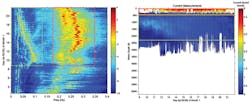
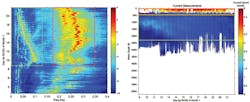
Acceleration Time Frequency Distribution (left), and ADCP Current Data (right).
To this end, a convergence of information technology (IT) with operational technology (OT) must take place. Subject matter expertise is needed to know what to look for in data and data analysis skills are required to find it. Once found, the impact can be disruptive. This article discusses some of the findings from subsea monitoring of marine riser and wellhead systems, which were gleaned over many deployments in various conditions.
Submerged currents
The subsea wellhead and drilling riser are susceptible to high fatigue damage rates when vortex induced vibration (VIV) occurs due to high currents during offshore drilling activities. The most challenging aspect of VIV analysis is converting currents to riser/wellhead vibrations, due to the complex fluid-structure interaction. Employing monitoring systems on the riser and BOP stack provides a direct window into the response of the system, circumventing this complexity. Information garnered from monitoring can be used in planning of drilling operations for future wells as well as improvement of analytical models.
Wellhead and riser monitoring using subsea vibration data logger (SVDLs) was performed while drilling in 6,000 ft of water in an environment with high surface and submerged currents. VIV of the drilling riser resulting from high surface currents was observed in the moonpool beginning in the latter half of the first month of the deployment. Observed vibration frequencies were around 0.2-0.3 Hz. A time frequency distribution (TFD) from a logger located on the BOP stack, is shown inFigure 1 (left). The color represents the intensity of acceleration “energy.” Two distinct bands of energy are visible. High frequency energy between 0.18 and 0.30 Hz is outlined with a red rectangle and lower frequency energy from 0.02 to 0.11 Hz is depicted with a green rectangle. While the high frequency vibrations were expected, due to observations of high surface current and riser motions in the moonpool, the cause of the low frequency vibrations was, at first, mysterious.
Simultaneously recorded Acoustic Doppler Current Profiler (ADCP) data offers an explanation for the presence of the lower frequency vibrations. ADCP velocity data is provided inFigure 1 (right). Comparing the outlined regions in the left and right figures, it can be concluded that the high frequency vibration is due to the strong surface current, while the lower frequency vibration is caused by the submerged current. Specifically, using the ADCP data and the Strouhal relation, the vortex shedding frequency associated with the surface current outlined in red was calculated to be 0.2-0.3 Hz. Indeed the frequency range in the TFD outlined in red is seen to be the same. Similarly, the shedding frequency calculated for the submerged current outlined in green on the right figure starts out at around 0.1 Hz on the ninth day of the month and reduced below 0.05 Hz by the 20th. This same trend in frequency of vibration is evident in the TFD outlined in green in the left figure. Importantly, because the wellhead response is larger at lower frequencies, the low frequency energy turned out to be the primary driver for wellhead fatigue.
By using the SVDL data, adequate wellhead fatigue life for continued drilling was demonstrated when other analysis methods resulted in marginal remaining life. On a longer term, measured data highlighted the significance of submerged currents in the region on structural integrity of the wellhead. The findings led to revised wellhead design and drilling operations for the remaining wells at the site, such as selection of fatigue-resistant wellheads and improved fairing coverage. Furthermore, the measured data allowed for refinement and validation of analytical predictions.
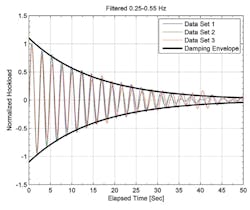
Free-Decay Data with 2.5% Damping Envelope.
Riser restrictions
Drilling riser and BOP stack systems (i.e., riser systems) are dynamically excited in the axial direction by vessel heave due to ocean waves. At water depths of 10,000 ft and beyond, the fundamental natural frequency of the riser system becomes close in proximity to the frequency of ocean waves, leading to resonance.
In this condition, the dynamic loads due to axial riser system response are a significant fraction of the riser system weight, leading to high combined loads. It is known that resonant dynamic response levels are quite sensitive to the amount of damping in the system. Calculated damping values due to known and quantified sources can be quite low, significantly less than 1% of critical damping, leading to relatively large dynamic loads in pre-deployment analytical simulations. As a result, low damping levels can lead to significant restrictions on riser running and retrieval. A little more damping can go a long way in reducing dynamic loads in analytical predictions. However, data justifying the use of higher damping levels has not been available.
During deployment of drilling risers from the host vessel, the riser system is suspended from the hook as it is being lowered onto the gimbaled spider, following installation of each consecutive riser joint. The vertical force comprised of the weight of the riser and BOP stack plus dynamic forces due to vertical oscillations of the riser system is measured by a load cell. Several impulse and decay data segments, representing axial free-vibration of the riser system, were obtained from different sets of hook load data. The overall damping level for axial vibration was identified from the data using modal identification techniques. Normalized waveforms of the free-decay time segments are superimposed inFigure 2 along with the damping envelope resulting from the identified damping levels.
Notably, the identified damping levels are substantially higher than those used in disconnected axial riser analysis. If the higher damping values are incorporated into analytical simulations, dynamic loads are significantly reduced. This leads to relaxation of riser running and retrieval restrictions. However, the level of damping is still small enough that axial dynamic response will be a significant consideration for large water depths, and must be carefully accounted for.
Model validation
The two relevant quantities for fatigue are the fatigue loading applied to the system and fatigue resistance of structural components. To demonstrate adequate fatigue life in pre-deployment analysis, the fatigue resistance must be shown to be greater than the fatigue loading.
Shallow-water drilling in harsh environments using floating drilling rigs designed for deepwater conditions can result in large cyclic loads imparted to the wellhead, due to large BOP stacks driven by vessel motions and direct wave loading. As a result of the arduous loading conditions, fatigue resistance margins are often computed to be very slim. Margins can be improved be refining either side of the equation: predicted loading or calculated fatigue resistance.
The loading aspect was recently investigated via a comprehensive monitoring program, consisting of BOP stack, riser and vessel motions, and on-site ocean wave and current measurements. Measured motions were compared to predicted motions from analytical simulations, driven by the measured waves and currents. The overall finding was that the analytical motions matched the measured motions quite well. However, some discrepancies were identified and investigated.
An important disparity, which was also observed in some data sets in deepwater, was related to measured and analytical BOP stack motions. The analytical motions were predicted to be larger than the measured motions near the so-called wellhead natural frequency (i.e., natural frequency of the wellhead, BOP stack, casing, soil subsystem). Two of the possible contributing factors are hydrodynamic damping on the BOP stack and damping in the soils. Sensitivity checks indicated that both sources of damping are significant and could account for the discrepancy. Investigations are underway to better quantify these damping levels. Enhanced estimates of system parameters will improve analytical models. This will enable more refined fatigue loading predictions, resulting in less operational restrictions and more efficient wellhead system design.
Conclusion
There is presently a great deal of excitement in the industry regarding digitalization and many startup companies in this arena are vying for business. Some recently minted buzzwords include: big data; analytics; machine learning; IoT; digital twin; dashboards; data science; cloud, edge and fog computing; and servitization. While these terms can appear intimidating to the uninitiated, companies serious about digitalization need only two basic elements: the right data and the expertise to know what to do with it.


