Duane Dickson, Andrew Slaughter, Anshu Mittal, Deloitte
The past five years of low and volatile oil prices have shaken the entire oil and gas industry. From corporate strategies, operational performance, financial results, to even innovation and talent, companies are exploring new ways to adjust to the new normal.
After a difficult 2015 and 2016, the industry began showing signs of coming out of the woods by mid-2018, with oil prices recovering to $85/bbl (Brent). Many industry executives appeared to regain confidence as their companies’ financials improved, resulting in growing optimism about 2019.
But then, oil prices surprised everyone by sliding more than 35% (Brent) to $50/bbl in the last quarter of 2018. If fears of oversupply and the three largest oil producers (Russia, Saudi Arabia, and the United States) competing for market share were not enough, the rise in geopolitical tensions and concerns of a global economic slowdown seemed to have dented the positive momentum built over the past 12-18 months in the oil market. Although the downward slide has now been halted by the November agreement between OPEC and its allies to curb supplies by 1.2 MMb/d, the steep fall amid heightened volatility marks five years of the collapse in oil prices from above $100/bbl levels in 2014.
How have O&G companies navigated the past five years of the downturn? Did the operational and capital adjustments of O&G companies translate into returns for investors? How have margins and value migrated between O&G segments? Which segment saw the highest fundamental-market divergence? Answering such questions could be essential to gain a complete perspective of the health and prospects of the O&G value chain.Although many industry pundits have provided piecemeal perspectives across the phases of the downturn and recovery, a consolidated analysis of the past five years and a complete perspective covering the entire O&G value chain could help stakeholders—from executive to investor—make informed decisions for the uncertain future.
With this in mind, Deloitte analyzed 843 listed O&G companies worldwide across the four O&G segments (upstream, oilfield services, midstream, and refining, and marketing) in an effort to gain a deeper and broader understanding of the industry. The ensuing research yielded a six-part series, “Decoding the O&G downturn,” which sets out to provide a big-picture reflection of the downturn and share our perspectives for consideration on the future.
The goal here is to explore the overall O&G industry in a detailed but concise fashion—its market dynamics, the health of its segments, regional performance, and innovation and talent.
Underperformance vs. divergence
In the pre-downturn period (2010–2013), the O&G industry commanded roughly 10% of listed companies’ market capitalization worldwide at around $5 trillion. By the end of 2018, this figure fell to 6%, with only two O&G companies in the top 25 companies of the world by market capitalization. The fall in the industry’s attractiveness has come at a time when the global economy expanded by 23% to $70 trillion over the past five years.
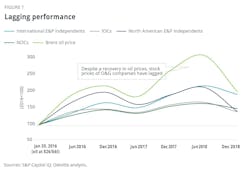
Undoubtedly, this reduced attractiveness of the industry because of lower and volatile oil prices and weaker financials of O&G companies. However, the market seems to have disregarded recent efforts of O&G companies to drive capital efficiency in their projects and overall financials. For example, the industry’s return on capital, which hit lows of 2.7% in 2016, has recovered fast and is today close to pre-downturn levels even in a sub-$65/bbl price environment (6.9% in 2018 as against 7.3% in 2013).Likewise, there has been far less appreciation of the fact that the industry maintained its higher-than-average dividend yield of 3.5% (as against 2.4% of other industries worldwide) even during the past five years of the downturn. The O&G industry returned more than $720 billion in dividends between 2014 and 2018, the second highest after the financial services industry. In addition, share buyback programs also transferred cash to shareholders.
Although the market’s expectation of sustained weakness in oil prices could explain this bearish divergence, the industry’s continued emphasis on operational performance, shareholder distributions, and free cash flows should not be ignored for long—it has the potential to help it to win back investors’ trust in the times to come. In fact, the industry was estimated to generate more free cash flow in 2018 than it did in 2013 when a barrel of crude traded at an average of $112/bbl.
Imbalance within the system
A fit-for-future O&G industry needs a healthy ecosystem of producers, service providers, shippers, and processors and marketers. Without it, the gains of a recovery would likely go to a select few, while losses from a downturn could affect many, potentially impairing the ability of certain segments to attract capital and grow sustainably. While it is normal for value and margins to migrate across the ecosystem, especially in a downturn, the migration in this downturn has been highly skewed and unhealthy for the most part. And this has been our big worry related to this downturn.
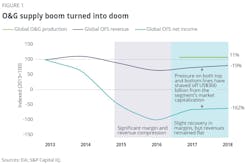
Although producers are recovering, and in some cases growing again, many in the oilfield services (OFS) segment continue to struggle for survival. For example, market capitalization of the OFS segment, which is the backbone for both shale growth and offshore revival, has fallen by half to $262 billion and the entire segment is now less than the size of the biggest supermajor. In fact, currently, only one OFS company figures in the list of top 25 O&G companies worldwide by market capitalization.
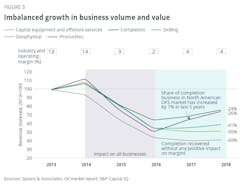
Conversely, operating margins in what have historically been the least lucrative O&G businesses, downstream and midstream, have shot up higher than what an average integrated producer and service company makes. For example, downstream margins of 6% are now higher than the 5% margins of a service company. Similarly, a midstream company’s fees/spread per unit of volume transferred has remained flat at a minimum, while the underlying commodity’s price has fallen by more than 50% during the downturn.
Today’s lopsided producer–contractor–customer relationship, or the health of the O&G ecosystem, means that stabilization in the industry may still be a few years away – or that a big rationalization could play out.
History lessons
History suggests that a fragmented industry in distress often paves the way for consolidation; large and financially sound players monetize such situations to strengthen their bargaining power and diversify their growth/risks. How have large OFS players evaluated and addressed fragmentation in the industry? Have they expanded their economies of scale (market share) and economies of scope (breadth of offerings) during the downturn?
Surprisingly, the OFS segment has never seemed as fragmented as it is today, five years into the downturn. OFS has now more than 1,000 listed and private companies worldwide and only six have a market capitalization of more than $10 billion. And, the market share of the top 25 OFS companies in the overall segment’s revenue has been at its lowest level of 52%, a fall of four percentage points from 2014.
In terms of scope, the story is only slightly better. Although the revenue share of nonmajor/secondary businesses has grown by three percentage points for the top 25, primary businesses still constitute about 75% of their revenue mix. Businesses such as downhole drilling tools, floating production services, and contract compression services seemed least impacted in the downturn but remained under-owned by large service companies.
With only $20 billion of M&A activity in 2018, would the segment have fared better if there was a consolidation? Although results are unclear – because even a few mega-mergers over the past few years are yet to deliver on stated synergies – alliances that reduced total “ownership cost” for both the parties, offered integration value to clients, provided cost and schedule certainty, and reduced interface risk/time of operators seem to have fared well. After a muted M&A activity, could there be a big M&A wave or consolidation in the offing?
Variability in valuations
Unlike earnings, which have remained highly variable, the more stable, tangible assets provide a clearer picture of the industry’s performance and attractiveness. The industry has remained undervalued in general, with the market valuing O&G companies significantly below their book value or replacement cost at around 0.8 times (enterprise value/total assets).
At a regional level, however, EV/asset multiples have varied significantly despite O&G being a commoditized industry. In fact, there is 20-40% divergence in the valuation of companies/segments by regions. Although North America-based O&G companies have seen a fall of 10% in their valuation multiple, investors still generally value them close to their replacement cost. On the other hand, Latin American and European O&G companies have largely seen a flat to positive change in their valuations over 2013 levels.
Similarly, most private integrated oil companies (IOCs) and state-owned national oil companies (NOCs), especially outside North America, have received much lower valuation despite their stable integrated and/or diversified structure. On the other hand, OFS has turned into the least valued O&G segment, while the multiple of downstream companies worldwide has not expanded like their margins over the past few years.
One can conclude that investors do not seem to be buying into the O&G industry just to play price and margin cycles in pure-play businesses/regions or to park money in the safety of integrated structures. Although company-specific strategies and results that provide an upside beyond simple oil price increase could dictate investors’ interest, such high differences in valuations in an improved macro and oil price environment could set the stage for mega- and cross-regional M&A in the O&G industry.
Employment and innovation
The fall and heightened volatility in oil prices have troubled many executives, upset investors, and led to unforeseen migration of value and margins within the O&G industry. But what has been the impact of this downturn on innovation and the workforce in the industry? Did the downturn, along with automation, affect hiring in the industry? Did O&G companies favor a manufacturing and mass production mindset over technology- and data-led optimization?
Although the industry’s overall employment levels fell during the downturn, 2017 saw a recovery in headcount, and the current employment numbers of 4.5 million are only 1% below the 2013 numbers. The reason: About 300,000 layoffs in oilfield services, pure-play E&Ps, and private IOCs were largely offset by a hiring of 255,000 employees by NOCs and pure-play midstream and downstream companies. Although redistribution of jobs between the segments/regions accelerated, especially those that are analytics-based, the industry’s volume growth and innovation seem to have supported overall employment by creating new and more work profiles.
Similarly, the 16% fall in the industry’s research and development (R&D) expenditure to $13.5 billion has been much less than its curtailment of capex. Impressively, the hardest-hit OFS segment maintained its R&D spending of $3.4 billion and downstream registered its highest R&D spend in 2017. On the other hand, surprisingly, most large IOCs and NOCs have reduced their absolute R&D spend despite the established role of technology in lowering breakevens during the downturn. Although internally generated innovation is generally considered important, a balanced and united focus on innovation is also critical as organizations must often complement their internal innovation capabilities with solutions, ideas, and technologies from external partners and vendors.
Lessons from the downturn
The lower-for-longer environment seems to have shaped the industry in its own unique way, and is likely to continue to do so in the near future. Although company-specific strategies that provide an upside beyond oil price and generate sustainable efficiencies will often determine investor interest, a few pointers could help the industry to respond favorably to the new reality:
• O&G companies with fit-for-future portfolios should effectively position themselves as a strong value/yield investment and strongly talk about their progress in growing free cash flows, maintaining shareholder distributions, and increasing their ROC to investors.
• Advantaged segments and players should bring a balance to today’s lopsided contractual relationships by sharing in the economics of efficiencies created by contractors and vendors, thus providing a win–win relationship.
• O&G companies across the value chain should stay invested in harnessing capabilities of the new-age workforce and remain open to accelerated innovation happening outside the industry as well.
Volatility has always been the name of the game in the O&G industry. However, the past five years have forced many companies to rethink their strategies. A strong understanding of the downturn could therefore help companies determine where to play and how to win.
Continuing oil price volatility, the downside of efficiency gains at the operators’ end, and a highly fragmented market continue to present unprecedented challenges to the OFS segment. Growing cyclicality in its asset utilization, commoditization of fees, and industrialization of processes suggest that the segment’s path to recovery may not be smooth either.
Although challenges are unique to each company and thus require tailored solutions, the following considerations could help bring a balance:
• Rapid changes in business dynamics, especially in the competitive hydraulic fracturing and capital-extensive offshore markets, could require higher operational agility and a nimble- and-timely scalability (scale up, scale down, and even scale out) approach across the value chain of their offerings.
• Overcoming the consequences of efficiency gains may require greater acceptance of performance-based contracting. This is likely to happen only if OFS companies can display the additional value they are bringing to operators while distinguishing themselves technologically and demonstrating their grip over the supply chain.
• With operators moving toward flexible investments and capital-light models, OFS companies should explore new forms of alliances and partnerships, even with operators and vendors, to reduce their “total cost of ownership” of assets and gain back some control over their rising “variable cost.” •
Editor’s note: This article is excerpted from Deloitte’s six-part study entitled “Decoding the O&G Downturn” (April 2019), which presents a consolidated analysis of the past five years and the entire O&G value chain.


