Updated processing methods, technologies enhance vintage frontier basin data
H. Nicholls, N. Hodgson, R.Gonzalez
Spectrum Geo Ltd.
M. Cvetkovic
Spectrum Geo Inc.
It is now commonly accepted that the only way to unlock new hydrocarbon provinces is by investing in modern methods of seismic acquisition and processing. However, new data is not always available and in some areas may be prohibitively difficult to acquire. Fortunately, the legacy of seismic acquisition over the last 50 years provides a resource base that can be re-examined. Data that is often forgotten and overlooked can be re-processed using modern techniques to provide new insight into frontiergeology.
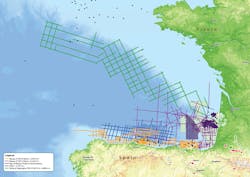
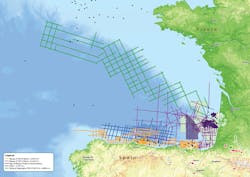
TheBay of Biscay, offshore western France and Northern Spain, has been extensively covered by seismic from the late 1960s to the early 2000s. Oil and gas fields have been discovered and produced, but there has only been limited drilling in the basin, and all of that on the narrow shelf. Due to a lack of investment in new seismic data, the existing legacy dataset is a valuable resource that allows us to better understand this basin. However, it exists only as a set of individual datasets, each processed independently of the other with no thought of tying them together. Unraveling the basin development has been hindered by these eclectic datasets.
Bay of Biscay
The Bay of Biscay is dominated by the Pyrenean foreland basin, yet comprises a complex palimpsest of earlier rift basins, including the Parentis and Aquitaine Basins to the east, and the Basque-Cantabrian Basin to the west. Source rocks are found from the Palaeozoic to Cretaceous, with the Kimmeridge and Baremian-Albian sequences being most prolific. Reservoirs are found from the Upper Jurassic to the Lower Cretaceous in both clastic and carbonate facies, and structures tested to date include extensional fault blocks, compressional folds/toe thrusts and salt diapir flanks.
Many thousands of kilometers of data have been acquired in the Bay of Biscay in many different surveys between 1968 and 2003, both commercial and academic, using several different seismic acquisition sources and recording systems. More than 12,000 km (7,456 mi) of these data, a subset of the total data available in the Bay of Biscay area, were selected for re-processing.
Re-processing of this legacy data proved challenging due to the poor quality of the support data supplied, and the large variety of seismic acquisition techniques used. Observer’s logs were often incomplete or unreadable, and measurements such as near trace offset and start of data delays had to be calculated from the raw seismic data. In several vintages, there were tape transcription problems leading to the loss or distortion of data, including the introduction of spikes which could only be removed by de-spiking routines. Navigation was supplied in a variety of formats, including as UKOOA P190 files, Excel files, typed from paper or extracted from the headers of previous vintages of processing. In all cases, the information was very poorly documented, most often containing no projection information whatsoever, so a detailed quality check was performed on the navigation to prepare it for merging with the seismic.
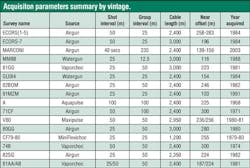
Once the line geometries had been built, each vintage was analyzed for its acquisition method. It was found that a variety of different seismic sources had been used, and each of these had a specific methodology of analysis and preparation. A total of 15 different surveys were included in the project, acquired using six different source techniques, as detailed in the table.
Overview of sources
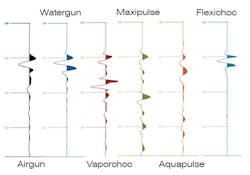
Although available in common literature, it is useful to briefly describe here each source technology found in this project.
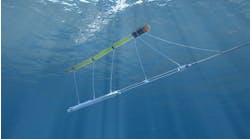
Air gun.The most commonly used marine source is the air gun which consists of two chambers charged to approximately 2,000 psi (138 bar) and an electronically actuated valve and piston assembly that releases high pressure air into the water column. The source signature from an air gun array is nominally minimum phase. A far-field signature was extracted from the data by summing a series of near traces derived from an area of water bottom showing little geological influence.
Watergun.The water gun source works on much the same principal as the air gun, except the high-pressure air is used to generate an implosion that results in a very high frequency mixed phase source signature. The far-field source signature was estimated from the recorded data in the same way as the air-gun far-field signature (Safar 1980).
Aquapulse. This is a submerged explosive source in which an oxygen/propane mixture is exploded inside a closed flexible chamber. While the source signature is nominally minimum phase, its timing can vary substantially. Consequently, considerable effort is required to determine and correct any observed timing variations. Once again a far-field source signature was estimated from the recorded data.
Vaporchoc. This source generates acoustic energy by injecting a measured quantity of superheated steam into the water column under very high pressure. A valve is opened and the steam forms a bubble in the water column, condenses, the bubble collapses and finally disappears. The timing of the bubble pulse varies for each shot, consequently a near-field source signature is recorded. A de-signature operator was computed by converting the mixed phase recorded near-field signature to its minimum phase equivalent with a Weiner filter, and applying this Weiner filter to each shot. This also accounted for timing variations for each shot.
Maxipulse. This is a delayed fuse dynamite source (Wood 1978), where bubble oscillations are recorded and used to compute a shot-to-shot minimum phase de-bubble filter. In this way the data is converted to zero phase and the timing variations attributable to the delayed fuse are corrected.
Flexichoc.This is an impulsive marine source comprising two spring plates separated by compressed air until they lock into position. When the source is triggered the air between the plates is expelled to form a vacuum, which forces the plates together generating an acoustic pulse. This emits a very short pulse, rich in high frequencies, which allows for high resolution. As for the majority of the other source types, a far-field source signature was estimated from the recorded data.
PSTM workflow
An initial assessment of the data confirmed a wide variety in wavelet shape and phase, as expected, caused by the different sources. The pre-processing involved correctly identifying the source type and deriving a suitable zero phase de-signature filter for each. In some cases, a suitable filter could not be derived, in which case a statistical zero-phasing would be performed post-stack. As well as phase, amplitude levels were also matched across all surveys. At this stage, we now have a set of pre-stack data of varying vintages and source types that have been matched to reference phase and amplitude level with phase being close to zero phase.
The different source techniques presented a set of challenges in the imaging sequence based on their different frequency spectra and phase. Hence, the next challenge was to process each data type as similarly as possible, but taking into account potential different responses to each step by reviewing frequency content at regular intervals.
This data was processed through a standard, conventional, modern pre-stack time migration processing sequence, resulting in an improved data quality and final imaging. Tailored suppression of coherent and random noise was performed in several stages of the workflow in various sorting domains. Velocity independent routines such as surface-related multiple elimination, where multiples are modeled and adaptively subtracted, proved successful in removing multiples early in the sequence. These led to improved removal of predictable noise from the data and subsequently allowed for improved velocity analysis and migration. Residual multiples were removed with tau-p deconvolution and radon. Diffraction and out-of-plane events were suppressed in the f-t domain with coherency amplitude threshold filtering. Automatic velocity analysis provided smooth, continuous velocity models that conform to geology. The subsequent residual normal moveout can improve the fine definition of faults and enhance horizon continuity. Key to the imaging was the emphasis on keeping the processing sequence for each vintage as similar as possible, in order to keep to a minimum any differences in the final data that may be attributable to the sequence. However, in some areas, it was appropriate to apply different techniques; for instance, tau-p deconvolution methods were utilized in shallow-water areas to remove persistent short period multiples, but this process is not effective in deep water.
Final phase matching
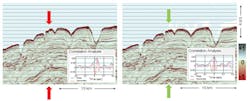
The final step in the processing flow was merging final velocity models and imaging stacks for all the datasets. A smooth 3D time domain RMS model that ties on all the lines can later be used as an initial model for future depth model building. For several vintages, zero phasing was difficult to achieve pre-stack, so post-stack phase matching was performed using a statistical method.
The most modern survey available was selected as the reference or base and, working across the area survey by survey, all other vintages were successively matched. Unmatched data was loaded into the interpretation software for additional mistie analysis. To achieve a level of statistical robustness, all intersections were examined and average values for matching vintages together were computed. Average phase and static shifts were computed and applied to each survey in turn. The result is a contiguous dataset consisting of multiple vintages that was not available previously in this frontier basin.
Geological benefits of re-processing
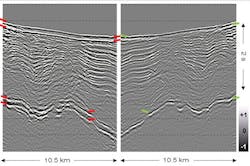
The re-processed data has significantly enhanced quality and interpretability throughout the section, which in turn has identified many geological features with potential hydrocarbon interest. The result is better signal-to-noise ratio and clearly removed multiples. In the shallow shelf section this enables better distinction of structures and sedimentological features. Improved imaging of continuous reflectors and structural geometries has yielded improved definition of faults and salt diapirism. Indeed, both salt walls and salt rafts are imaged for the first time in this area. Deeper structures are better resolved, giving a more comprehensive understanding of the basin’s geological evolution and history as well as prospectivity of the area at source rock level.
Conclusions
Applying modern processing techniques to data acquired decades ago can produce stark improvements in imaging. However, these improvements require particular care in understanding the seismic source signal. Once this is correctly managed, a modern processing sequence which focuses on noise and multiple removal is particularly successful in enhancing the data, providing a consistent and coherent dataset. These techniques often remain the only method of obtaining enhanced data in areas now subject to strict environmental laws. In the Bay of Biscay, this has revealed new insights into the structures, plays and exciting hydrocarbon prospectivity of this basin. The reprocessed data is a tool for planning new acquisition and identifying new areas for exploration.
References
Wood, L. C., Heiser, R. C., Treitel, S. and P. L. Riley, 1978, The Debubbling of Marine Seismic Sources: Geophysics, 43, 715-729.
Safar, M.H.,1984, On the S80 and P400 water guns: a performance comparison: First Break, 2, no. 2, 20-24
Gray, S. H., 2014, Seismic imaging and inversion: What are we doing, how are we doing, and where are we going? 84th Annual International Meeting, SEG, Expanded Abstracts, 4416-4420.
Jammes, S., Manatschal, G., and Lavier, L., 2010, Interaction between prerift salt and detachment faulting in hyperextended rift systems: The example of the Parentis and Mauléon basins (Bay of Biscay and western Pyrenees). AAPG Bulletin 94, no. 957-975
