Geospatial navigation and analysis service increases well construction efficiency
Jon Skillings
Sergey Martakov
Andreas Hartmann
David Larsen
Baker Hughes
In complex geological formations, optimizing wellbore placement presents a difficult challenge. Failure to mitigate reservoir uncertainty often results in suboptimal ultimate recovery and increased nonproductive time. A new geospatial navigation and analysis service increases well construction efficiency by reducing seismic uncertainty and avoiding costly pilot holes and unplanned geological side tracks.
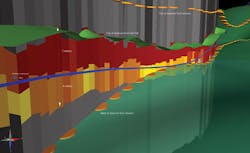
The VisiTrak geospatial navigation and analysis service makes it possible to define reservoir architecture by mapping multiple bed boundaries in real time, without the need for pilot holes that are typically drilled to evaluate the formation before drilling the horizontal portion of a well. The service combines extra-deep azimuthal resistivity readings with full interpretation of complex geological scenarios and advanced 3D visualization to provide a better understanding of reservoir architecture. Using the service, it is possible to detect remote boundaries up to 30 m (100 ft) from the wellbore with azimuthal sensitivity around the borehole. This impressive depth of detection (DOD) provides a reservoir-scale view, opening new opportunities in real-time for wellbore placement and reservoir mapping by taking reservoir navigation interpretation from near-borehole to the seismic scale.
Geospatial analysis
The service provides a unique opportunity for improved understanding of a reservoir’s architecture and its near-wellbore sand distribution, which are necessary for optimal placement of the wellbore in the most productive zones. The service is based on electromagnetic (EM) measurements that have long been used in logging-while-drilling (LWD) tools with deep-reading capabilities. The measurements are enabled by a set of at least one transmitter and one receiver coil, where the transmitter coils are driven with alternate currents to create an alternating magnetic field in the rock formation. The magnetic field produces eddy currents in the conductive rock formation. These, in turn, produce a secondary magnetic field that can be sensed at a receiver coil. The detected signal is a function of the passage of the primary signal through the formation and the particular coil geometry used.
The EDAR-based geospatial navigation and analysis service uses two types of coil arrangements housed in a two-module bottomhole assembly (BHA): (1) a coaxial differential measurement; and (2) a cross-component absolute measurement. The transmitter for the coaxial measurement is housed in the shorter of the two modules. The second, longer module contains the receivers for the coaxial and cross-component measurements, and a transmitter for the cross-component measurement. For the coaxial measurement, all coils are aligned with the tool axis. For the cross-component measurement, a transmitter orthogonal to the tool axis is used. The signal attenuation and phase difference between the two receivers are related to the resistivity of the surrounding medium. In a homogeneous medium, symmetry prevents any signal reception by the coaxial receiver. A remote boundary introduces asymmetry in the eddy current and a measurable signal in the receiver. This measurement is azimuthally sensitive because of the asymmetry.
The absence of a direct signal, as in the coaxial measurement, is particularly useful for this type of tool, because it achieves a large DOD with relatively small transmitter-receiver distances. The short transmitter-receiver spacing positions the modules closer to the bit, which enables earlier detection of remote reservoir boundaries.
The modules operate at two frequencies-20 and 50 KHz-and there is no need for an additional downhole generator to power the system. For each frequency, long-space measurements of phase difference and attenuation resistivities are provided, along with directional signal strength measurements that provide a 360° reservoir-scale view of the borehole. These measurements provide inputs to the multi-component inversion modeling software, which supports detection of multiple boundaries both above and below the wellbore, at distances up to 30 m from the borehole.
Case study: Barents Sea
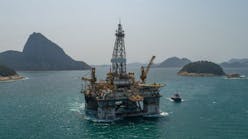
A recent project on the Norwegian continental shelf in the Barents Sea illustrates the benefits of the geospatial and navigation service described above. The field is located 85 km (53 mi) northwest of Hammerfest, and is the first oil-producing field in the Barents Sea. It is characterized by a large number of faults and a relative high structural dip toward the flank of the structure. The Kobbe formation is one of several proven hydrocarbon reservoir units in the field. It is of Middle Triassic age and is divided into two main subgroups. The Upper Kobbe is essentially a prograding deltaic system with mouth bars and tidal influenced lobes. The Lower Kobbe shifts into a more proximal, heterogeneous fluvial setting where sand bodies have limited lateral continuity.
Effective drainage of the field calls for horizontal wells, in which the 8½-in. reservoir section must be initiated in the overlaying Snadd shale. Wellbore architecture is driven by the need to minimize both shale exposure in the landing section and unwanted intra-shale drilling. Early detection of the reservoir top and accurate mapping of the reservoir sand architecture remote to the wellbore are necessary to successfully navigate this type of complex reservoir.
The operator selected two horizontal gas injectors as the best production solution. These were the first two horizontal wells drilled into the Kobbe formation. Because of the reservoir’s steep, fault-prone structure, ensuring optimal gas injection would require penetrating all compartments. However, wellbore trajectory was restricted to 1.5-degree dogleg severity after the landing.
The geospatial navigation and analysis service enabled detection of the top of the reservoir at about 20 m (66 ft) true vertical depth and 99 m (325 ft) measured depth before entering the reservoir, ensuring an optimal wellbore landing. Extra-deep measurements also helped reduce uncertainty in fault detection, where related throw can be estimated based on the displacement of boundaries. The increased DOD, combined with advanced multi-component inversion-while-drilling techniques and real-time 3D visualization of data and reservoir model, helped ensure successful placement of the well. Real-time mapping of the reservoir geometry helped optimize reservoir exposure. The operator drilled approximately 1,000 m (3,281 ft) with an average ROP of 28 m/hr (92 ft/hr) and achieved an 80% net-to-gross ratio.
Case study: Brazil
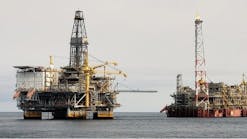
The Carapebus reservoir is a series of gravity flow channel deposits on the continental slope margin of the Campos basin offshore Brazil. The reservoir is subdivided into three facies types, with facies 1 being the only productive sand type. A
n operator in the field wanted to drill a horizontal well through the sand. However, sand distribution in the well landing area was unclear because of seismic interpretation limitations. The operator selected the geospatial navigation and analysis service to navigate while drilling the 8½-in., 1,018-m (3,340-ft) horizontal section.
The plan was to drill a 12¼-in. hole to the top of the reservoir and set 95⁄8-in. casing. The well inclination would then be built to land at 90 degrees and maintain position in the target sand before drilling into the lower sand. Total depth was at the start of a deep channel that cut across the well trajectory. The minimum net sand interval was set at 300 m (984 ft), with a key performance indicator minimum of 460 m (1,509 ft).
Efficient drainage from the gravity flow sandstone in the heavy oil field requires a high level of sandstone contact. An azimuthal LWD measurement deeper than the traditional 20 m was necessary to increase sandstone content in the horizontals by improving the ability to steer within relatively thin sandstone bodies, or to identify and drill neighboring thicker sandstone bodies above or below the well trajectory. The extra-deep, look-around measurements helped bridge the gap between traditional wellbore measurements and seismic data. Integrating these data types enabled interpretation of the reservoir structure and geometry to be refined, resulting in better constrained reservoir models and an improved field development strategy.
The well was drilled successfully without a pilot hole. True vertical sand thickness was 10-14 m (33-46 ft) at the heel of the well. After crossing the crest into the lower channel, thickness increased to 10-25 m (33-82 ft). Target sand thickness was mapped while following the upper surface of the sand, and the well followed at a distance of 2-3 m (7-10 ft).
When faults and channel margins were crossed, inversion modeling results were used to target the correct reservoir sands. A total net sand length of 865 m (2,838 ft) of sand length was drilled, which equated to a 75% net-to-gross ratio across the 1,019-m (3,343.2-ft) horizontal section.
As these examples illustrate, bringing reser- voir navigation interpretation from borehole to seismic scale makes it possible to identify multiple bed boundaries at five times the distance of conventional services to open new opportunities for real-time wellbore placement. As a result, operators can make faster drilling decisions to navigate to the most productive zones, while eliminating time-con-suming pilot holes.
