Jon Fredrik Müller
Rystad Energy
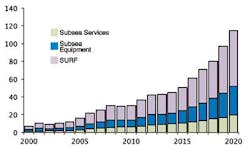
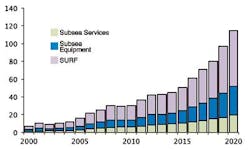
In the beginning of the year 2000, oil companies' globalsubsea expenditure totaled $7 billion. The market grew tremendously to a high of more than $30 billion in 2008. After the financial crisis, the market softened as operators reduced investments and put projects on hold to conserve cash. Since 2011 it has regained growth, and in 2014 the expenditure is forecasted to reach $45 billion.
Since 2011, the price of oil has shown a downward trend, while the operators' capital expenditure has continued to grow. This has put pressure on companies' free cash flow, which has led to a reduced growth in investments.
However, relying on the latest demand scenarios by IEA, analysis by Rystad Energy indicates that the supply/demand balance for liquids will get tighter toward 2020. Offshore is forecasted to be the most important source of new liquids production. In fact, it has the potential to deliver more than three times the volumes of unconventional tight/shale production in the US, measured by new liquids production expected by 2020. As the market gains more transparency on the forecasted tighter supply/demand balance, there will be a new investment cycle starting in 2015.
From 2013, the operators' subsea expenditure is forecasted to grow by an annual rate of 15%, to $115 billion in 2020. To reach this expenditure level, operators need to continue to sanction projects. However, to put it in perspective, this growth rate is far less than the 25% annual growth during the five-year investment cycle culminating in the market high of 2008.
SURF expenditure forecast
The forecasted market growth has a different effect on the various market segments. SURF (subsea installation, umbilicals, risers, and flowlines) and subsea equipment (trees, wellheads, manifolds, etc.) are related mainly to field development. So, these segments fluctuate with thefield development activity. Toward 2020, subsea equipment and SURF are both forecasted to grow by 16% per year.
Subsea services are related mainly to inspection, maintenance, and repair. This segment is driven by the size and the age of the installed base of equipment. This is a less volatile, but steady growing segment, forecasted to rise by 12% per year from 2014 to 2020.
Subsea tieback facilities
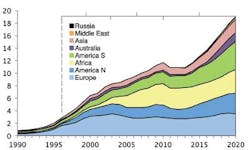
Production growth from floating andsubsea tieback facilities comes in different waves. The first wave in the 1990s and beginning of the 2000s was driven by Europe (North Sea) and North America (Gulf of Mexico). From the mid-2000s until today, Africa (Angola and Nigeria) that has been the most important driver for increased production from floating and subsea facilities. Toward 2020, it will be South America (Brazil), Australia, and the Gulf of Mexico that are forecasted to contribute the largest production increase from these types of facilities.
At the beginning of the millennium, the subsea market was dominated by the US, Norway, the UK, and Brazil, together making close to 80% of the total market. These countries are still the most important subsea markets globally, but in 2014 their share of the market is forecasted to be approximately 55%. The reduced market share is largely due to the emergence of other subsea regions likeWest Africa and Australia. By 2020, the market share of the "big four" is forecasted to be reduced even further, to an estimated 45% of the total market.
Largest subsea region
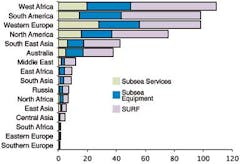
West Africa is estimated to be the largest subsea region over the 2014-2020 period, followed by South America, Western Europe, and North America. In total, these four regions are forecasted to make up over 70% of the global market with a combined expenditure of $95 billion from 2014-2020. The expenditure per market segment differs between the regions based on maturity and activity level. In a mature region such as Western Europe, subsea services constitute a larger share of the total market than in South America, which is a less mature subsea region.
The market in West Africa is dominated by Angola (41%) and Nigeria (28%). There is a larger uncertainty regarding the market forecast in Nigeria, given the failure to pass effective petroleum legislation, resulting in uncertain timing of investments in the country. Total obtained the necessary approvals from Nigerian National Petroleum Corp. to award the main EPC contracts for the development of the offshore Egina field in June 2013. Other large projects expected start development toward 2020 includes Kaombo Phase 1, PAJ, and Bonga Southwest.
InSouth America, Brazil makes up the lion's share of the market -- 90% over the 2014-2020 period. Numerous large FPSO developments will come with extensive subsea infrastructure and installation investments. The market for flexible pipes is especially strong in Brazil, given Petrobras' preferred development solution of pulling flexible pipes straight from the christmas tree to the FPSO with limited use of manifolds.
Western Europe consists primarily of the Norwegian (55%) and United Kingdom (40%) markets, with a total spend of $57 billion and $37 billion, respectively, over the 2014-2020 period. Compared to thedeepwater markets of West Africa, Brazil, and the Gulf of Mexico, the North Sea market consists mainly of shelf and midwater developments.
In North America, the US and Mexico make up 75% and 15% of the market, respectively. Additional activity is mainly focused around the east coast of Canada (around 10%). After a down period following the financial crisis and theDeepwater Horizon incident, the market has rebounded and is forecasted to continue to grow, reaching $16 billion in 2020.
Subsea technology has come far over the last 20 years. In most regions, subsea production systems are now considered a conventional part of offshore developments. The first two steps toward the subsea factory - booster pumps and separation - are proven. With the first full-scale deployment of subsea gas compression just a couple of years away, the industry continues to expand the market space for subsea-related equipment and to enable future developments that may not be commercial or technically feasible today. With a good portfolio of projects, there should be a high development activity going forward.
