Susan Lock Williams Veritas Hampson-Russell, division of Veritas
When one considers the milestones in the application of seismic methods to further oil and gas exploration over the last 20 years, one usually thinks first of the progression from 2D to 3D and now 4D (time-lapse) seismic.
So, in some respects prestack depth migration (PSDM) might be considered one of the quiet revolutions in seismic technology. Its evolution marked the transition from focusing primarily on “time” in the modelling and interpretation of seismic data to investigating the possibilities in “depth.”
Without PSDM, much of the oil and gas now being found and produced in complex geological settings around the world, notably in the Gulf of Mexico, North Sea, and off West Africa would not have been identified or, more to the point, accurately imaged.
One reason that PSDM has never hit the headlines is because even now it is a complicated process requiring resources and expertise that limit its availability. It is a computer-intensive process, and oil companies as a rule will only contemplate PSDM when the potential results seem likely to add significant value to the seismic data. That said, companies such as Veritas found that the value of multi-client offshore seismic surveys in relevant areas of complex geology can be significantly enhanced by offering PSDM data as part of the final product.
PSDM can provide exploration companies with a form of extra insurance, especially when drilling in deeper water where the cost of failure is high. It has proved itself to be an especially important exploration tool for hydrocarbon provinces with a mobile substrate such as salt. The basic imaging problem with a salt dome or other salt presence is that the salt typically has a much higher interval velocity than the surrounding sediments (as much as 2:1). This in turn creates a number of issues which the processing geophysicist must try to resolve because salt emplacement affects key prospect elements of trap, migration, and reservoir distribution.
In essence, the improved understanding of the subsurface offered by PSDM helps to reduce risk, and in recent years this has been proven time and again in the deepwater GoM where operators have carried out PSDM on seismic data as part of their appraisal program for major new discoveries.
The ultimate goal is to arrive at a fully defined 3D salt geometry. This usually entails generating multiple interpretation models to test and develop the final salt velocity model. The process is complicated, and individual service companies will all have their own proprietary algorithms to arrive at the required result.
Industry standard practice for building PSDM velocity models where salt overhangs or sedimentary inclusions are involved is an iterative technique. It calls for a succession of interpretation steps followed by seismic migration processing for top salt, base salt, and subsequent salt to sediment interfaces, until the salt geometry is satisfactorily defined. Sedimentary inclusions can be particularly troublesome because they are sediment packages completely enveloped within the salt body. Similarly a salt overhang has its complications: it is best described as a shallow salt body overlying a sedimentary package which has a deeper salt body below it.
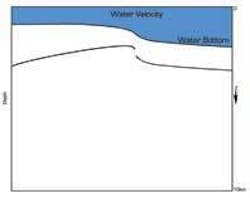
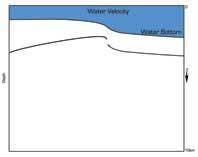
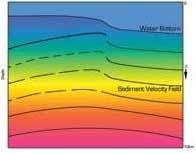
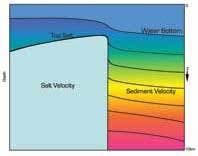
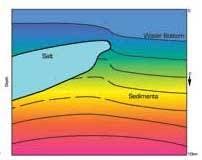
As a first step, PSDM algorithms are used to accurately position salt-sediment interfaces and subsalt reflectors that may be prospective reservoirs. These iterative steps are required to produce a seismic image of subsalt stratigraphy. A simplified diagram of this process is shown sequentially in Fig. 1A-1D and is described below.
It is important to realize that seismic data are initially acquired in the time domain and that the depth migration process depends on the accuracy of the velocity model. The first step in the velocity model building process is to correctly position the water bottom reflection or seabed topography in depth by migrating with the velocity of water, which is constant at approximately 5,000 ft/s (~1,500 m/s),
The second step in the process is to interpret the water bottom in depth to establish a reference datum for the sediment velocity field. A good estimation for the alternating sand/shale stratigraphy of the GoM is a gradient model represented by V = Vo + kZ (where Z is depth, k is velocity gradient which varies with depth, Vo is an initial velocity). Vo and k are derived from the calculated root mean square (RMS) velocity field by flattening prestack gathers through a process of normal move-out correction.
This velocity field can be thought of as the description of the background sediment velocity profile into which the salt body geometry needs to be positioned and defined.
In other words, we first create a gradient model into which salt can be emplaced through iterative interpretation.
Updates to the sediment velocity field are then performed using 3-dimensional grid based global tomography. Steps 1 and 2 are detailed in Fig. 1A.
The third step is to run a sediment flood migration using the updated sediment velocity field. If salt is present, a distinctive interface is revealed as the slower sediment velocities encounter faster salt velocity. This is observed as a peak or positive acoustic impedance contrast (a change in rock properties, i.e. the variation in velocity and density, across the interface). An exception exists when the interval velocity of salt and sediments are similar and the acoustic impedance contrast is minimal. The top salt surface is then interpreted on this sediment flood volume in step 4, Steps 3 and 4 are represented in Fig. 1B.
Step 4: Interpret top salt
Step 5 is to build the top salt model where salt velocity (~14,700 ft/sec, ~4,480 m/s) is used below the interpreted top salt surface in a seismic migration process to correctly image the base salt reflection. This volume is referred to as the salt flood volume on which the base salt surface is interpreted (step 6). A distinctive interface is revealed as the faster salt velocity encounters slower sediment velocities. This is observed as a trough or negative acoustic impedance contrast. Steps 5 and 6 are shown in Fig. 1C.
Figure 1C: Step 5: Salt flood Step 6: Interpret base salt
The final step (7) in the iterative PSDM process is to place sediment velocities below the interpreted base salt surface. This is shown in Fig. 1D. The bodies defined by the interpreted top and base salt surfaces create the salt geometry that must be represented by salt velocity in order to correctly image subsalt reflectivity.
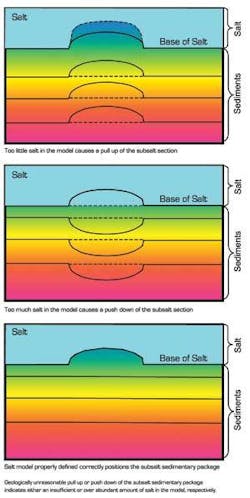
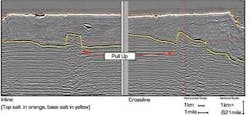
In areas where the salt body geometries are simple, the process described here will generally image subsalt reflectivity. In complex salt provinces, further interpretation and migration steps are often required. Distortions in the subsalt sedimentary package may be used to indicate where the true salt geometry has not been accurately interpreted. Fig. 2 shows the subsalt sedimentary package response when the top and base salt interfaces have not been accurately described. A geologically unreasonable ‘pull up’ or ‘push down’ of the subsalt sedimentary package typically indicates either an insufficient or an overabundant amount of salt in the model, respectively.
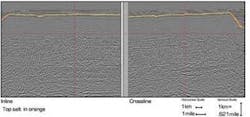
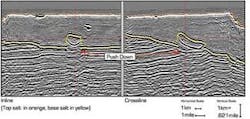
When it comes to the velocity model building process in an area of complex salt containing a sedimentary inclusion, the procedure differs in some important respects. Fig. 3 - 7 demonstrate several examples of orthogonal inline and crossline pairs, where the crosshairs indicate the tie point. Fig. 3 illustrates a sediment flood volume on which the top salt surface was interpreted, seen as the orange horizon on the figure. Because this is the initial sediment flood, the base salt reflection is not well imaged. Fig. 4 shows the initial salt flood on which the base salt surface was interpreted, represented by the yellow horizon. The “push down” in the subsalt sedimentary package is induced by the slower velocity of a sediment inclusion which was not defined in this migration iteration. The base salt surface identifies the top of the sedimentary inclusion.
null
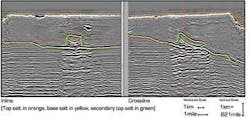
A preliminary model is shown in Fig. 5. This step places salt velocity between the interpreted top and base salt surfaces, with sediments surrounding the salt body represented by sediment velocity. Note the “pull up” in the subsalt sedimentary package indicating there is an insufficient amount of salt in the model because the inclusion has yet to be fully defined.
Figure 5: Preliminary model, secondary top salt interpretation
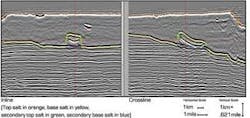
On the preliminary model volume (Fig. 5), a secondary top salt is interpreted which defines the base of the sedimentary inclusion. The top of the sedimentary inclusion exists at the base salt-to-sediment interface. The next step is to migrate the seismic data with a partial salt flood, illustrated in Fig. 6, which places salt velocity below the interpreted secondary top salt surface. This step is required in order to accurately position the ultimate (sub-regional) base salt reflector below the inclusion, as well as define the additional salt required in the model to properly image the subsalt reflectors.
Results from the final migration incorporating the fully defined subsurface velocity model, inclusive of the sedimentary inclusion, is shown in Fig. 7. As noted on the inline of Fig. 7, the subsalt reflectivity is now well defined. Faults are clearly visible in the subsalt section, highlighting additional sedimentary complexity and compartmentalization. This would not have been illuminated without application of the correct salt velocity model used in conjunction with PSDM.
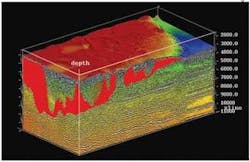
The final step, Fig. 8, shows the integrated 3D velocity model in conjunction with the seismic backdrop showing shape and structure of the extra-salt and subsalt sections of the deepwater GoM. For the purposes of this article, the interpretation and migration steps described illustrate the processes involved for a relatively simple salt-sediment inclusion situation. Fig. 8 indicates the true “real life” complexity of salt provinces like the GoM. It also points to an increasing trend in the application of seismic methods for both exploration and reservoir analysis, namely the amount of integrated work effort shared between seismic processing specialists and interpretation geoscientists.
One could say that PSDM is one of a number of evolving techniques challenging the traditional boundaries between data processing and interpretation departments. One of the important implications is that the whole process, from initial seismic data acquisition through to final visualization and interpretation, is becoming increasingly intertwined. Even at the acquisition stage, there is an increasing emphasis on pre-planning of surveys to generate data of the quality required to obtain maximum benefit from subsequent imaging treatments such as PSDM. This integrated and iterative interaction is bringing tremendous advance to accurately describing the subsurface in complex exploration salt provinces so that hydrocarbon potential and the risk involved can be adequately assessed.
